12 Best Free Pie Chart Maker Software For Windows
Here is a list of Best Free Pie Chart Maker Software for Windows. You can use these software to create 2D pie charts, and some of these let you create 3D pie charts as well. You just need to enter the data, and these software will generate pie chart for you. You can customize pie slices, like, specify colors, transparency, labels, etc.
While some software in this last are stand-alone pie chart software, rest are free office suites that come with built-in feature of making pie charts. Those are even more beneficial, as you can use their spreadsheet module to add the data, and then directly generate pie chart from them.
I have also covered pie chart templates that you can use with popular Office suites, to make even better pie charts than what are included by default.
Apart from pie charts, you can also create other types of charts with these freeware, like: Line, Bar, Area, Bubbles, column, XY, etc.
So, if you want to represent a data graphically, whether for business use, education use, and for any other purpose, then these Pie chart maker software will help you. Read out this article and pick the software that works for you best.
My Favorite Pie Chart Maker Software:
Graph Maker is one of the best Pie Chart Maker Software, and of course my favorite. I like it because of its simplicity. It requires only name and related numerical data to be entered and it will automatically create Pie charts for the given data. The best thing about it is that it can be easily used by novice users as well. You can easily understand how to make Pie chart by a demonstration. Scroll down to read more about this Pie chart creator software.
You can also check out List of Best Free Gantt Chart Software For Windows, Best Free Flowchart Software For Windows, and Best Free Mosaic Maker Software For Windows.
Graph maker: Free Pie Chart Maker
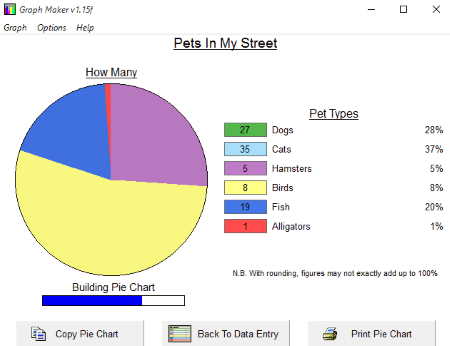
Graph maker is a free cross platform Pie chart maker software. To create a Pie chart, you have to provide some details. You need to fill: Description-X and Value Y. Description-X accepts details of data type, like name, etc. Value Y is the numerical values. This Pie chart maker can create up to 6 sections in a Pie chart.
If you still feel difficulty in filling these values then you can understand it through an example. Just click on the Open option and open the example.gog document. This document will automatically fill all data. Then, you will get an idea about how to fill these details to make a Pie Chart. You can Print or copy a Pie chart to the clipboard. This Pie chart maker software can also create Bar graph and Line graph.
Free Graph Maker
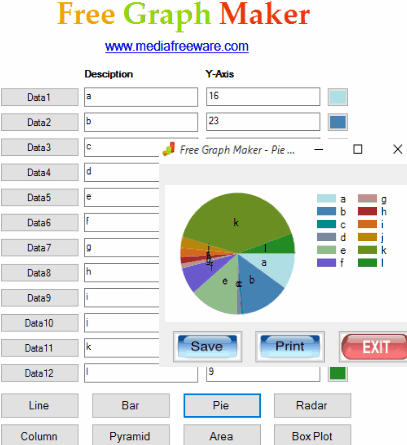
Free Graph Maker is a free Pie chart maker software. You have to fill some details like description and Y-axis values to make a Pie Chart. Click on Pie option to create Pie chart and represent your data on a creative pie chart.
It lets you fill upto 12 numerical data points, so you can divide Pie chart into 12 sections only. This Pie chart maker lets you fill only data, and you cannot choose colors. Colors are already assigned to each section. All twelve section have different colors, you just have to assign values to them.
This Pie chart maker software also lets you create other charts or graph like Line graph, Column graph, Bar graph, Pyramid graph, Area graph, Radar graph, and Box graph.
You can save Pie chart as JPEG Image, Bitmap Image, and GIF Image. This Pie chart maker can print Pie chart as well.
OpenOffice
OpenOffice is a free office suite, that includes Spreadsheet software, word processor, and many more modules. The best part is that it lets you create pie chart in its different modules, on the same lines as you can create with MS Office. Both OpenOffice spreadsheet and OpenOffice writer let you create attractive Pie charts. You can create any of these Pie charts:
- Pie (Regular).
- Pie of Pie
- Bar of Pie
- Doughnut
- 3D Simple Pie
- 3D Realistic
- Other graphs like: Bar, Column, Line, Area, Line, XY, Bubble, etc
Each of the pie charts can be made 2D or 3D.
How To Create Pie Chart Using OpenOffice Spreadsheet:
- Open new spreadsheet.
- Create a table of data with values.
- Click on Insert>Chart>Pie chart.
- Choose type of pie chart you want to create.
- You can do different customization, like set labels, etc.
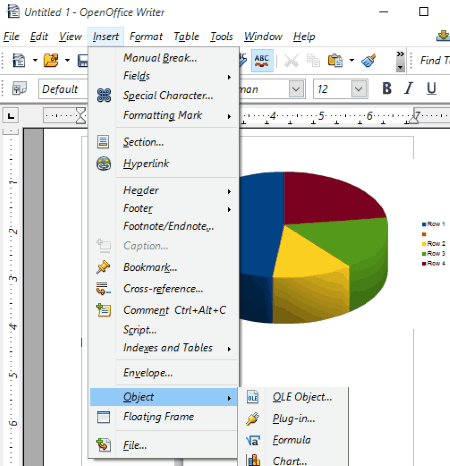
How To Make Pie Chart Using OpenOffice Writer:
- Open a new document.
- Click on Insert menu.
- Go to Object>Chart. A regular chart will be inserted on your document.
- Right click on the chart to open its Context Menu.
- Choose Pie chart from Chart Type option.
- Right click and go to Chart Data Table to enter Pie chart data.
You can also change colors on the chart, edit its look, add a title, add descriptions, etc. After you have created your Pie chart, you can either save it either as ODT, DOC, DOCX, RTF, etc. formats or export the document as PDF.
LibreOffice
LibreOffice is a fork of OpenOffice, and is a good free office suite.You can easily utilize it to create a Pie chart. Simply insert a chart in a document, just like I showed above how to do in OpenOffice. You can create many different types of Pie charts like:
- Regular Pie.
- Exploded Pie.
- Donut Pie.
- Exploded Donut Pie.
- 3D Simple.
- 3D Realistic.
- Other types of charts like: Line, Bar, Area, Column, Stock, etc
Lets go through the steps to create Pie chart here in LibreOffice spreadsheet and LibreOffice Writer.
How To Make A Pie Chart Using LibreOffice Spreadsheet:
- Open a new spreadsheet.
- Create a data table.
- Insert Pie chart through Insert>Chart>Pie.
- Choose the type of pie chart that you want to create, and your pie chart will be ready for you.
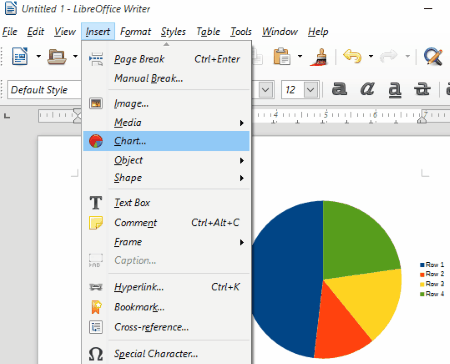
How To Make A Pie Chart using LibreOffice Writer:
- Create a new document.
- Go to Insert>Chart.
- Right click on chart to select Chart Type. Choose Pie option.
- Right click again to enter Chart Table Data.
In both cases, you can edit data through Edit data option, edit color,change label, add description, etc. This software lets you save your Pie chart as DOC, DOCX, RTF, ODT, etc. file or you can export it as PDF.
WPS Office
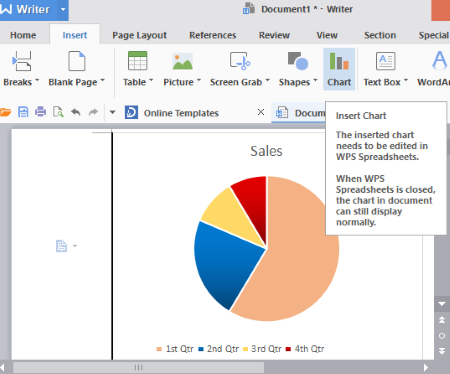
WPS Office is another popular office suite. This freeware also lets you insert Pie chart and other charts in a Word document and Excel sheet. Like other office suite, it also lets you create many types of graphs and Pie chart like Pie of Pie, Bar of Pie, Doughnut, Line graph, bar graph, column graph, etc. You can easily create a pie chart in few steps here.
How To Create Pie Chart Using WPS Spreadsheet:
- Open New spreadsheet.
- Create a table of data to create Pie chart.
- Insert a pie chart through Insert> Pie chart Icon.
How To Create Pie Chart Using WPS Writer:
- Open a new document.
- Go to Insert tab, then click on Chart icon.
- Fill data through Edit Data option.
Click on a Pie section to change its visual attributes. Fill, line, shadow, glow, size, transparency, and other effects can be set individually for different pies.
As it is a word processor, it lets you create a word documents with all necessary options and features. You can create, save, print, and share your documents. Save your Pie Chart in word formats or export as PDF.
It is a cross platform software: Windows, Mac Os, Android, and Linux.
Sales Pie Chart Templates
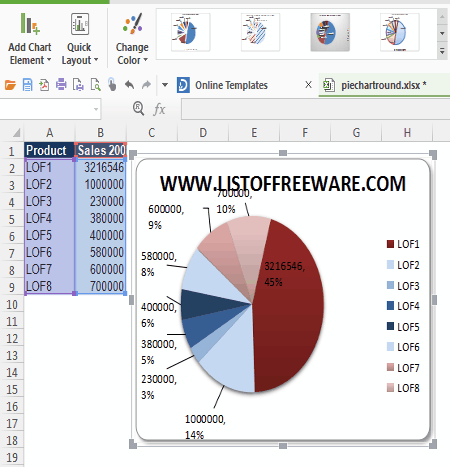
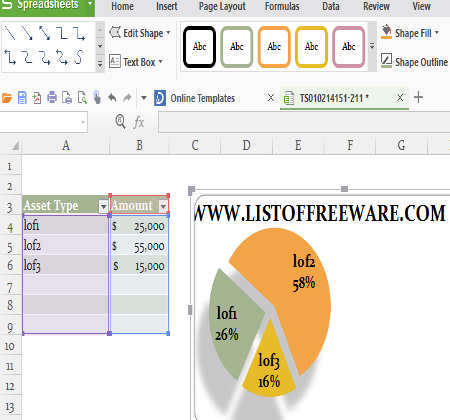
Sales Pie Chart Templates is a free template of Pie chart. You can use it with any office suite after extracting its ZIP file. When you open it with an office suite like WPS, Libre and Apache, it will automatically create a Pie chart with 8 sections. You can edit its data which is displayed in a table. It lets you create a maximum of 8 sections only. All sections have predefined colors. You cannot edit these colors.
3D Pie Chart Template
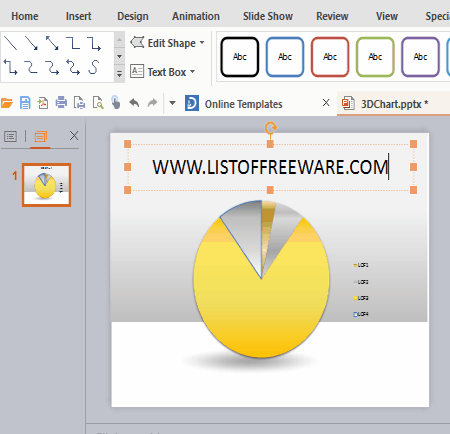
3D Pie Chart Template is another free template of Pie chart for presentation. You can add this template to your presentation after extracting its ZIP file. It shows only fractions of data value without any label. You can edit data through right click>Edit Data option. This option directs you to an excel file containing a table of data. Edit this data table to edit the Pie chart. Maximum 4 sections can be created in Pie chart. Other properties like color, shadow, gradients, transparency, text options can be edited. 12 different styles of pie chart can be created.
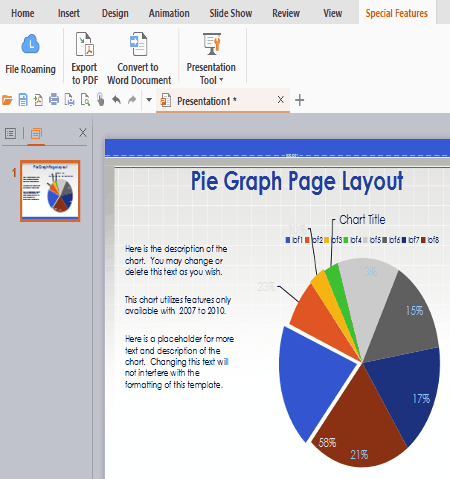
21st Century Pie Chart
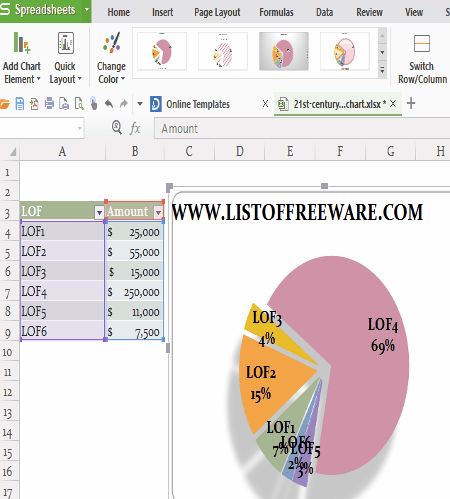
21st Century Pie Chart is a good free Pie chart template. You can create an attractive Pie charts in 12 different styles. Maximum 6 sections can be created in Pie chart. Apart from these, you can change its color combination, data, label, etc. Other types of charts and pie charts can also be created like: Doughnut, Bar of Pie, Pie of Pie, Line graph,Column graph, area chart, etc.
Business Pie Chart Presentation
Business Pie Chart Presentation is a pie chart template which helps you to create Pie charts in your presentation. It is a collection of charts in slides. You have to select one of them as per your need and edit it. You can add many sections as per your need. Right click context menu contains some options to edit data, Title and subtitle. A Pie charts can be created in 12 different styles. There are various colors set available to edit Pie chart color.
Pie Chart Data Arrangement Template
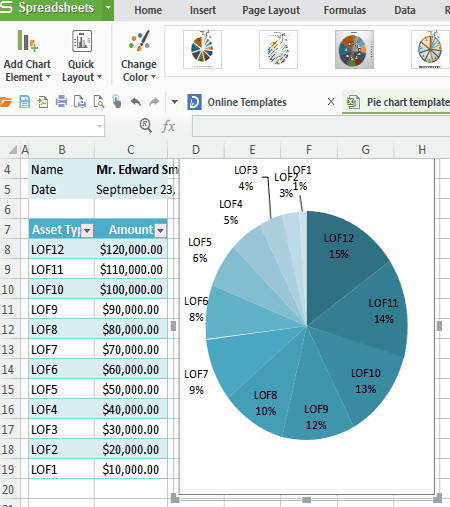
Pie Chart Data Arrangement Template is a free template for creating Pie chart in an excel sheet. Unzip the folder and open it in an excel sheet. Edit data through Edit data option. You can create Pie chart in 12 different styles with your favorite color combination. Maximum 12 sections can be created in a pie chart.
Amazing Pie Chart For PowerPoint
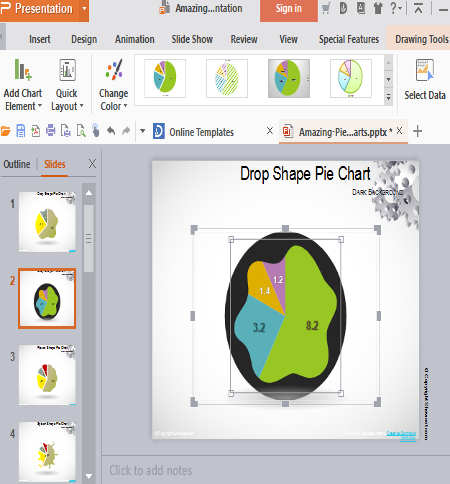
Amazing Pie Chart For PowerPoint is a free diagram of Pie chart for presentation. It incorporates different type of templates. Select any of them according to your need and edit them. You can use different styles of Pie chart and edit its color combination. Change background design and colors. Edit data through data table. It also lets you create Doughnut, Bar of Pie, Pie of Pie, etc.
Excel Templates
Excel Templates is a free Pie chart templates for excel sheet. It lets you create a Pie chart in 12 different styles. You can edit data, change color combination, edit text, edit label, edit background, etc. You can divide a Pie chart into maximum 6 sections. It can also create Doughnut, Bar of Pie, and Pie of Pie.


About Us

We are the team behind some of the most popular tech blogs, like: I LoveFree Software and Windows 8 Freeware.
More About UsArchives
- April 2024
- March 2024
- February 2024
- January 2024
- December 2023
- November 2023
- October 2023
- September 2023
- August 2023
- July 2023
- June 2023
- May 2023
- April 2023
- March 2023
- February 2023
- January 2023
- December 2022
- November 2022
- October 2022
- September 2022
- August 2022
- July 2022
- June 2022
- May 2022
- April 2022
- March 2022
- February 2022
- January 2022
- December 2021
- November 2021
- October 2021
- September 2021
- August 2021
- July 2021
- June 2021
- May 2021
- April 2021
- March 2021
- February 2021
- January 2021
- December 2020
- November 2020
- October 2020
- September 2020
- August 2020
- July 2020
- June 2020
- May 2020
- April 2020
- March 2020
- February 2020
- January 2020
- December 2019
- November 2019
- October 2019
- September 2019
- August 2019
- July 2019
- June 2019
- May 2019
- April 2019
- March 2019
- February 2019
- January 2019
- December 2018
- November 2018
- October 2018
- September 2018
- August 2018
- July 2018
- June 2018
- May 2018
- April 2018
- March 2018
- February 2018
- January 2018
- December 2017
- November 2017
- October 2017
- September 2017
- August 2017
- July 2017
- June 2017
- May 2017
- April 2017
- March 2017
- February 2017
- January 2017
- December 2016
- November 2016
- October 2016
- September 2016
- August 2016
- July 2016
- June 2016
- May 2016
- April 2016
- March 2016
- February 2016
- January 2016
- December 2015
- November 2015
- October 2015
- September 2015
- August 2015
- July 2015
- June 2015
- May 2015
- April 2015
- March 2015
- February 2015
- January 2015
- December 2014
- November 2014
- October 2014
- September 2014
- August 2014
- July 2014
- June 2014
- May 2014
- April 2014
- March 2014
