8 Best Free Bar Chart Maker Software For Windows
This article contains a list of Best Free Bar Chart Maker Software For Windows. The listed freeware can create a bar graph and other types of charts including pie chart, line graph, area graph, scatter plot, stock chart, bubble chart, and more. Not just creating a bar graph, these software provide a good number of customization options which help you create a visually appealing and more informative bar chart. These options include data range and series settings, text customization, font and display settings, editing title, chart layout, chart area, etc.
As most of these are office suites, these bar graph generator software follow the same procedure in order to create a bar graph. You first need to create a spreadsheet or import an existing one (XLS, XML, ODS, XLT, ETT, DIF, WKS, etc.). After that, select data entries and create the bar chart using respective option. These provide various subtypes of a bar graph to choose from, such as clustered bar graph, stacked bar graph, percentage stacked bar graph, grouped bar graph, segmented bar graph, etc. In some of these bar graph generators, you have the flexibility to create a bar graph in 3D look.
In most of these bar graph creator software, you can export the created bar graph as an image. The supported image formats include the popular ones, such as BMP, PNG, JPG, GIF, etc.
My Favorite Bar Chart Maker Software For Windows:
LibreOffice is my favorite bar graph maker as it is a commonly used office software and provides most number of bar graph customization options. If you want a dedicated utility to create a bar graph, you can try Free Graph Maker.
Also, you may like to checkout best free Organizational Chart Makers, Spreadsheet Software, and Gantt Chart Creators for Windows.
LibreOffice
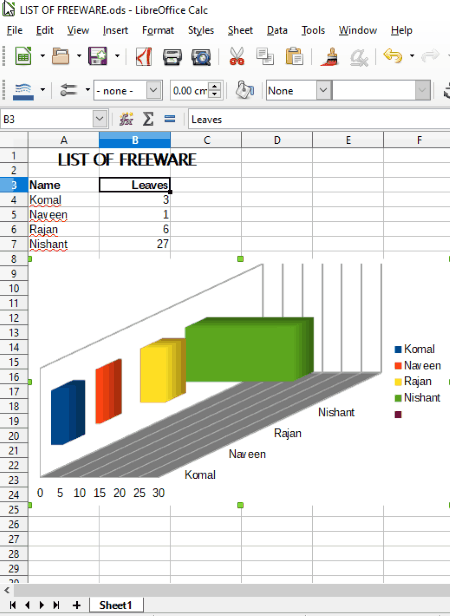
LibreOffice is a popular free and open source office suite for Windows, Linux, Mac, etc. platforms. It consists of various utilities like word processor, spreadsheet creator, drawing application, etc. To create a bar graph, you need to use its spreadsheet application i.e. LibreOffice Calc. Let’s see how to create a bar graph or any other graph like pie chart, area graph, bubble, etc.
Simply open LibreOffice Calc and add data entries to the blank spreadsheet. You can also import a spreadsheet in formats like XML, XLS, XLT, ETT, DIF, WKS, ODS, etc. After creating or editing the spreadsheet, select desired data entries to plot respective bar graph. Now, you just need to click Chart option from Insert menu and choose plot type as Bar Graph. This will create a normal bar graph. To personalize it, you get following options in the Chart Wizard:
- Not just 2D, you can plot the bar graph in 3D too. The mode to draw a graph can be Realistic or Normal. The shape of bar can be customized to simple bar, cylinder, cone, or pyramid.
- It provides few subtypes of a bar graph to customize bar graph look, e.g. stacked, percentage stacked, deep, etc.
- Data series can be represented in rows or columns.
- You can customize data range for individual data series.
- Other customization options include titles, grid, and legend settings.
- On double clicking the chart, you can customize Chart Wall properties like border, color, width, transparency, area, gradient, pattern, transparency, hatch, etc.
As you make changes to the bar graph, the preview of graph is shown in real time.
The created bar graph can be exported as an image in various formats like PNG, BMP, JPG, GIF, WMF, TIF, SVG, etc. Plus, you can export it as a PDF too using the same option. The whole spreadsheet with bar graph can be saved as ODS, XLSX, XML, CSV, etc. files.
LibreOffice is a great alternative to create a bar graph. You can also make use of its various additional tools like mathematical functions, formulas, spellcheck, protect spreadsheet, etc.
SoftMaker FreeOffice
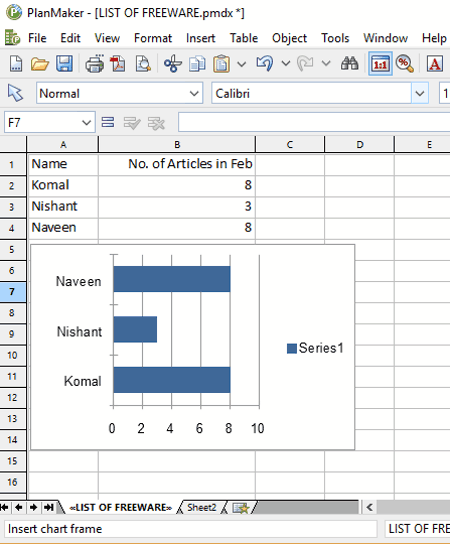
SoftMaker FreeOffice, as the name implies, is a free office software. It comes with a PlanMaker application which can be used as a bar chart maker or any other chart maker (line, area, bubble, radar, scatter, etc.). Its a spreadsheet maker where you need to create a spreadsheet by adding data entries manually or importing an existing spreadsheet. Now, follow these simple steps to create a bar graph:
- Select data entries and go to Object > New Chart Frame and select chart type as Bar. You can choose the desired subtype of bar graph from the given ones.
- It lets you select a desired color palette (bright color, pastel color, etc.) too. In addition, you can customize data source (area, row or column representation, etc.) and series (bar shape, X values, Y values, etc.) settings.
- The preview of bar graph is shown in the chart wizard.
- The chart can be formatted by personalizing text, font, chart area, chart properties (size, scale, chart elements, 3D view, etc.), etc.
It supports PNG, JPG, BMP, GIF, and TIF image formats to save the bar graph.
SoftMaker FreeOffice contains a wide list of features to create documents, spreadsheets, etc. You can checkout its feature list on the link given below.
WPS Office
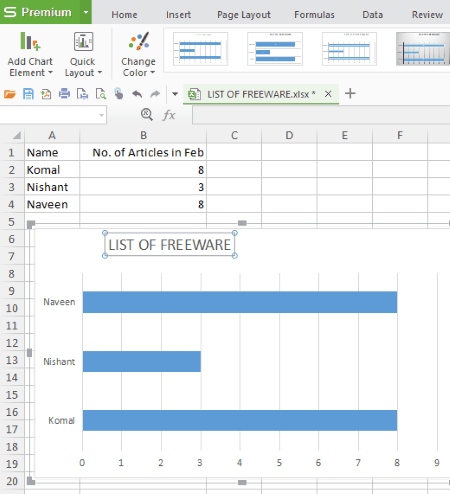
WPS Office is another office software which can be used as a bar graph maker. Like other office suites, its spreadsheet program is needed to create a bar graph. The procedure to create a bar graph is same as above discussed software. Firstly, you need to create a spreadsheet with data entries or import one as spreadsheet files. Then, select the data entries and from Insert menu, click on Chart button and choose bar graph. The bar graph can be a clustered bar graph, stacked bar graph, or 100% stacked bar graph. From Chart Tools menu, you can customize bar graph style, color, chart elements (axis title, data label, legend, etc.), and more.
You can add a title to the chart and format chart and text styles. For chart and text options, you can customize respective fill and line color, effects (shadow, glow, soft edges, 3D format, 3D rotation, etc.), and size and properties.
The created bar chart can be exported in four popular image formats, namely, PNG, TIF, JPG, and BMP. You can even copy the bar graph and paste it into an image editor to further modify it.
WPS Office is another good option as a bar graph maker. As it is a spreadsheet maker, you can utilize its tools like functions, formulas, drawing tools, etc.
Note: It is an ad-supported software.
Gnumeric Spreadsheet
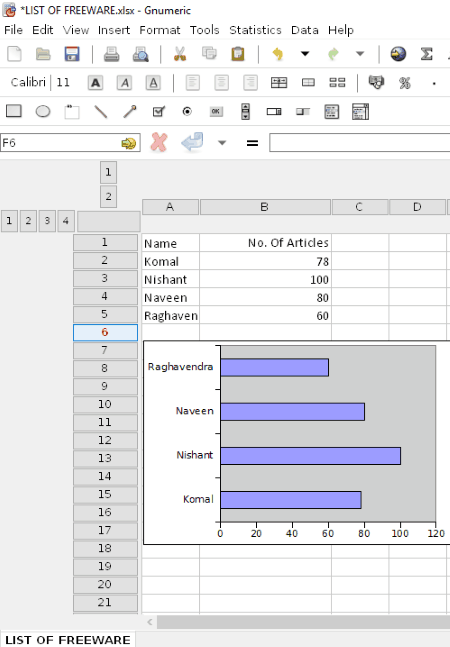
Gnumeric Spreadsheet is a spreadsheet creator software which can be used as a bar graph creator. Like other software, here too you have to follow three simple steps to create a bar graph. The steps are:
- Add data entries or import them as a spreadsheet file.
- Select all entries.
- Go to Insert menu, click on Chart option, and select plot type as Bar graph. You can also select a bar graph subtype and customize series as rows or columns.
That’s it. Simple, isn’t it?
It provides bar graph customization options too. You can customize chart properties by modifying axes settings, font, layout, style, text orientation, effective area, etc.
It lets you export bar chart as a PNG, SVG, JPEG, PDF, EPS, PS, etc. file. The graph can be printed too.
Gnumeric Spreadsheet is another good bar graph generator and an overall chart maker software. It can be used to create charts like column, pie, contour, drop bar, matrix, surface, ring, radar, polar, etc.
IBM Lotus Symphony
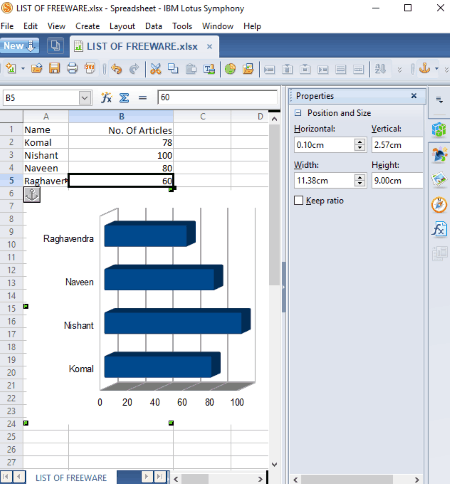
IBM Lotus Symphony is a free alternative to Microsoft Office. It provides all applications and tools which you need in an office software. To create a bar graph, at first, create a spreadsheet or open an already existing one. After that, select data entries and go to Create > Chart. From the Chart Wizard, choose chart type as Bar, select subtype as normal, stacked, or percent stacked, enable or disable 3D look, specify data series in rows or columns, customize data range for individual data series, and modify titles, grid, and legend settings. The alterations made to the bar graph are previewed in real time.
To modify the bar graph look, you can customize chart area (border, color, transparency, etc.), text, axis properties, chart wall, etc. After that, you can only copy the final bar graph to the clipboard and edit in an image editor. Although, the spreadsheet with bar graph can be saved in multiple formats like PDF, ODS, XLS, XLT, etc.
IBM Lotus Symphony can be your another alternative to create a bar graph. It has a multi-tab interface which lets you work on different projects at a time.
Free Graph Maker
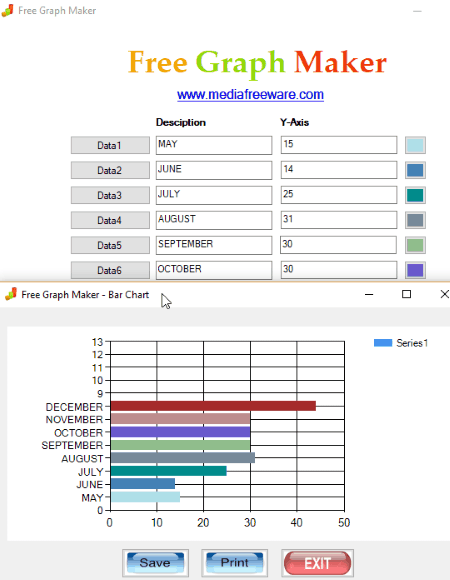
Free Graph Maker is a dedicated freeware to create a bar graph and other kinds of data visualization graphs like pie chart, area chart, pyramid chart, box plot chart, radar chart, etc. It is a straightforward bar graph generator as you just need to add dataset in respective fields. It lets you add up to 12 numbers of data entries with respective description and values. The different data value is depicted in distinct color schemes. After adding required data, click on Bar button to visualize data as a bar chart.
To save the bar chart, you can either print it or save it as an image file. Supported image formats include JPG, BMP, and GIF.
Free Graph Maker is a hassle free graph maker. The only limitation I find in this software is that it lets you create a bar graph for only 12 data entries.
Graph Maker
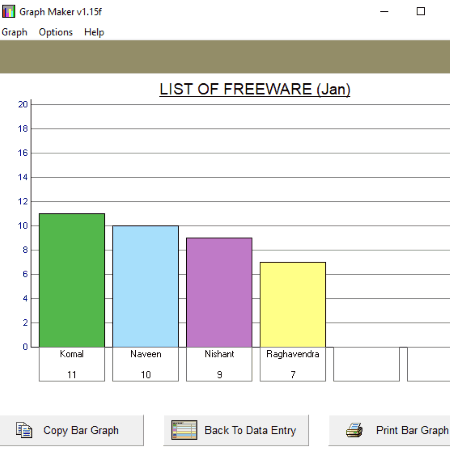
Graph Maker is another free bar graph maker software for Windows. Apart from bar charts, it can also create line graphs and pie charts. Just add data entries with respective description (along X-axis) and values (along Y-axis). You can add only six data entries in this software. Now, add a title of the bar graph and click on Build a Bar Graph button. It will create a bar graph as visible in the above screenshot. If you wish, you can go back to data entries and edit them at any time.
The created bar graph can be copied to the clipboard and pasted into an image editor to edit and save as an image. You can also print the graph. Apart from that, data entries can be opened or saved in its own file format only.
Graph Maker is another dedicated utility to create a bar graph.
SSuite Office
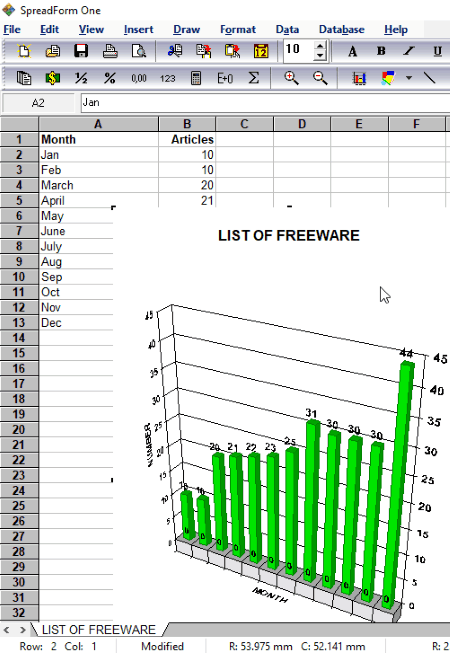
SSuite Office is basically a free office software for Windows. It consists of various applications including Wordprocessor, Envelope Printer, SpreadForm One, Internet Timer, etc. SpreadForm One is a spreadsheet application which can be used as a bar chart maker. It lets you create both 2D and 3D bar graphs. Let’s see how.
Just launch SpreadForm One and start creating a spreadsheet by inserting statistical data for which you want to create a bar graph. You can also import a spreadsheet as Excel (XLS), Tabbed Text (TXT), and Formula One (VTS) files. After you finish creating a spreadsheet, simply go to Insert menu > Chart option (or press F6) and then choose Bar from the Chart Wizard to visualize the data as a bar chart. Remember that you first have to select the entire or desired part of data entries. Now, to modify the bar graph, you get a lot of customization options. Let’s have a look at them:
- You can create bar chart in 2D or 3D.
- It provides 6 different types of bar graph styles to select from, like stacked bar graph, grouped bar graph, segmented bar graph, etc.
- You can personalize the output bar graph by adding chart title and chart footnote and selecting chart legend and series data along row or column.
- It also lets you edit axis titles.
To save the bar chart, it provides a Copy as Image option. But, this option didn’t work for me. Although, you can save the spreadsheet with bar graph in formats like PDF, XLS, VTS, etc.


About Us

We are the team behind some of the most popular tech blogs, like: I LoveFree Software and Windows 8 Freeware.
More About UsArchives
- April 2024
- March 2024
- February 2024
- January 2024
- December 2023
- November 2023
- October 2023
- September 2023
- August 2023
- July 2023
- June 2023
- May 2023
- April 2023
- March 2023
- February 2023
- January 2023
- December 2022
- November 2022
- October 2022
- September 2022
- August 2022
- July 2022
- June 2022
- May 2022
- April 2022
- March 2022
- February 2022
- January 2022
- December 2021
- November 2021
- October 2021
- September 2021
- August 2021
- July 2021
- June 2021
- May 2021
- April 2021
- March 2021
- February 2021
- January 2021
- December 2020
- November 2020
- October 2020
- September 2020
- August 2020
- July 2020
- June 2020
- May 2020
- April 2020
- March 2020
- February 2020
- January 2020
- December 2019
- November 2019
- October 2019
- September 2019
- August 2019
- July 2019
- June 2019
- May 2019
- April 2019
- March 2019
- February 2019
- January 2019
- December 2018
- November 2018
- October 2018
- September 2018
- August 2018
- July 2018
- June 2018
- May 2018
- April 2018
- March 2018
- February 2018
- January 2018
- December 2017
- November 2017
- October 2017
- September 2017
- August 2017
- July 2017
- June 2017
- May 2017
- April 2017
- March 2017
- February 2017
- January 2017
- December 2016
- November 2016
- October 2016
- September 2016
- August 2016
- July 2016
- June 2016
- May 2016
- April 2016
- March 2016
- February 2016
- January 2016
- December 2015
- November 2015
- October 2015
- September 2015
- August 2015
- July 2015
- June 2015
- May 2015
- April 2015
- March 2015
- February 2015
- January 2015
- December 2014
- November 2014
- October 2014
- September 2014
- August 2014
- July 2014
- June 2014
- May 2014
- April 2014
- March 2014
