5 Best Free ECG Simulator Software For Windows
Here is a list of Best Free ECG Simulator For Windows. ECG is an acronym for Electrocardiogram. It is the record of the electrical activity of the heart. By studying ECG patterns, doctors can find out abnormalities in the patient’s heart.
These free ECG rhythm simulator can be used for both training and learning purposes. You can learn and simulate different types of ECG waves. Some of the ECG waves include QRS wave, Wolff-Parkinson-White, Atrial fibrillation, Ventricular fibrillation, Atrial Flutter, Ventricular extrasystole, etc.
You can vary different factors and analyze their effects on the heart rhythm. Such factors include heart beats per minute, the magnitude of the P wave, the QRS wave, etc.
One of these software displays the heart view and the thorax view separately. You can select different nodes on the surface of the heart and it generates the TMP (transmembrane potential) plot for the selected node.
My favorite ECG Simulator for Windows:
ECGSIM is my favorite ECG simulator for Windows. It generates the TMP plot for every selected node on the heart surface. You can select one node at a time by default, but if you want, you can select more than one nodes. Moreover, you can also change the shape of the TMP.
You may also like some best free Hospital Management, Dental Lab, and Medical Manager software for Windows.
ECGSIM

ECGSIM is a free ECG simulator software for Windows. It can be used for both educational and research purposes for free. ECGSIM lets you study the relationship between the heart electric current sources and the resulting ECG (electrocardiographic) signals on the body as well as on the surface of the heart.
The entire interface of the ECGSIM is divided into four parts: The heart view, the TMP view, the thorax view, and the leads view. Let’s discuss these views in detail.
- The Heart view: The heart view displays the geometry of the heart. You can select the different nodes of the heart with the left click of the mouse. The TMP (transmembrane potential) plot is generated for every selected node on the surface of the heart in the TMP view. In the default mode (single region), you can select only one node at a time. If you select another node on the surface of the heart, the previous node will be deseleted. The expand region lets you select more than one nodes on the heart surface. Besides this, you can also vary the radius of the zone of the selected node. In order to rotate the heart, press and hold the right click of the mouse and drag it in any direction.
- The TMP view: ECGSIM displays the TMP (transmembrane potential) for every selected node on the surface of the heart. In the TMP view, two types of traces are displayed: white trace and red trace. The White trace refers to the initial parameter values of TMP and the Red one displays the user-adapted parameters for TMP. There is also a time bar (a yellow colored vertical line) which you can move left or right using the left mouse click. You can change the shape of TMP by dragging it with the help of triangular arrows on the red trace. You can also select various signals (measured ECG, adapted ECG signals, adapted ECG, EGM, and std curve) to show/hide.
- The Thorax view: As the name suggests, it displays the geometry of the thorax. You can rotate the thorax in the same way as you rotated the heart in the heart view. You can also link the heart and thorax orientation in order to rotate both of them simultaneously. It lets you select a node on the thorax using left mouse click and its respective ECG plot is drawn in the leads view.
- The Leads view: The leads view displays the ECG signals for the different lead systems, which include standard_12, VCG_(Frank), BSM_(nijmegen_64), minimap_montage, and single_lead. The VCG (Vector Cardiogram) system displays the different cross-sections of the thorax along with their ECG signals plot.
Each of the above-listed views can be copied to the clipboard easily. Just place the mouse cursor on the view which you want to copy and press Ctrl+C button.
Vital Sign Simulator

Vital Sign Simulator is another free EKG simulator software for Windows. It comes with two windows: Operator interface and Training window. In the operator interface, you can change the different parameters and view their effect on the ECG signal in the training window.
It lets you learn different types of ECG rhythms, like Sinus rhythm, Ventricular bradycardia, Atrial fibrillation, Atrial flutter, Asystole, etc. Select any of the available rhythms and click on Apply button to view the structure of that ECG.
You can adjust the heart rate from 20 to 200 beats per minute using the slider or entering value manually. After adjusting the heart rate, click on Apply button. The ECG will change according to the newly set heart rate. Similarly, you can also vary the SpO2, etCO2, Respiratory rate, and Non-invasive Blood Pressure (NIBP).
By default, the training window does not display the simulation of selected ECG in the operator interface. In order to simulate the ECG in the training window, you have to click the HR available and ECG available checkboxes. Also, you have to check the respective boxes of SpO2, etCO2, Respiratory rate, and NIBP in order to make them available in the training window.
In the training window, you can deliver a shock to the patient using the respective button. You can also deliver a synchronized shock to the patient by enabling the SYNC button. The SYNC button will turn yellow when it is enabled. Moreover, you can also analyze the patient, enable pacemaker, and do different experiments.
You can read the manual of Vital Sign Simulator here.
simECG
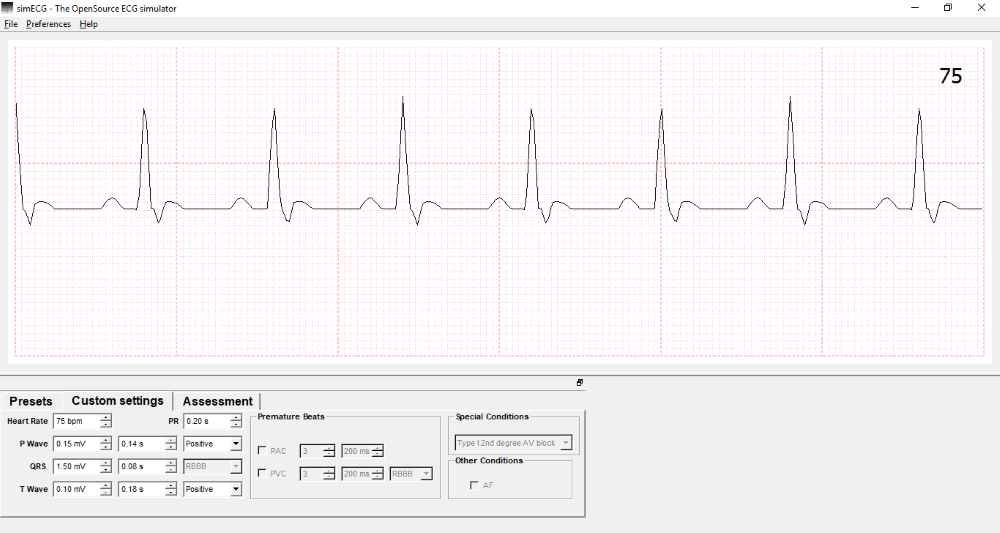
simECG is a free and open source ECG simulator for Windows. This software is developed for both training and assessment purposes. It comes with several predefined rhythms. Hence, this software is helpful for students to learn different types of rhythms. Some of these rhythms include Sinus Rhythm, Junctional Rhythm, Sinus Bradycardia, Sinus Tachycardia, Idioventricular Rhythm, Monomorphic VT, etc. All of these rhythms are available in the Presets tab. Simply click on any of the rhythm and simECG generates that rhythm on the interface.
In the Custom Settings tab, you can analyze the effects of variation in different factors on the heart rhythm. You can vary:
- The heart rate (in beats per minute) and its preset time (in seconds).
- The magnitude of the P wave by changing its value (in millivolts) and its preset time (in seconds). You can also invert the P wave.
- The magnitude of QRS wave by changing its value (in millivolts) and its preset time (in seconds).
- The magnitude of T wave by changing its value (in millivolts) and its preset time (in seconds). Like P wave, T wave can also be inverted.
After learning the structure of different types of heart rhythms, you can take the Assessment test. In this assessment test, you will be asked 10 multiple choice questions. Each question will have an ECG signal displayed. You have to select the correct option for that ECG signal. The time duration for each assessment test is 60 seconds. Your score and the time taken to complete the assessment test is displayed after the completion of the test.
It comes with two types of backgrounds: ECG paper and monitor.
simECG is a nice and fun ECG simulator which is another good choice for students to learn about ECG signals.
ECG_Types
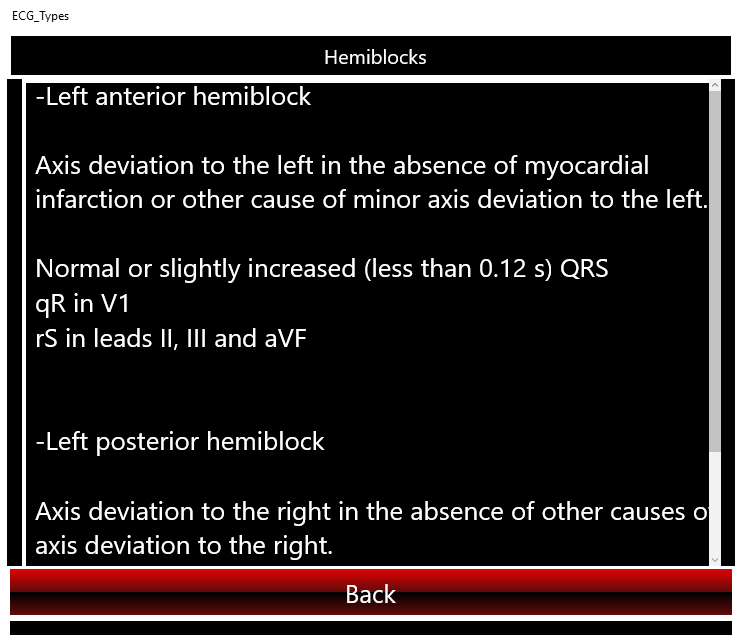
ECG_Types is a free cardiac rhythm simulator app for Windows 10 PC. It is a very simple application which is developed for educational purposes. You can learn different types of ECG waves generated at different heart conditions by using this Windows 10 app. There are more than 30 ECG waves to learn. On clicking a wave, the structure of which you want to learn, it simulates that wave on the screen.
Some of the heart waves are QRS wave, Wolff-Parkinson-White, Hemiblocks, Atrial fibrillation, Ventricular fibrillation, Atrial Flutter, Ventricular extrasystole, Atrial extrasystole, Left bundle branch block, Right bundle branch block, Grade1 AV block, Mobitz type 1, Fusion beats, etc.
You can read the information of each wave by clicking on the +Info button (click on above screenshot). You can also Play/Pause the simulation of a wave.
Patient Monitor
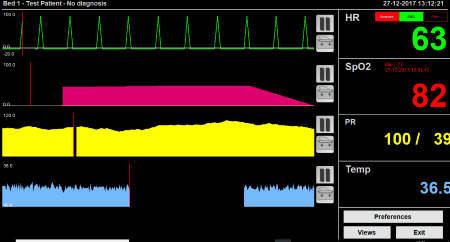
Patient Monitor is a simple ECG simulator software for Windows. You can set the lower alarm limit and upper alarm limit of the heart rate, SpO2, systolic pressure, diastolic pressure, and temperature. To do this, click on the parameter and set its limits with the help of a slider.
Talking about the graphs, it displays 6 different graphs, namely, EKG, Pleth, SpO2, systolic pressure, diastolic pressure, and temperature. You can change the resolution time interval, graph line color, graph background color, etc. of each of these graphs.


About Us

We are the team behind some of the most popular tech blogs, like: I LoveFree Software and Windows 8 Freeware.
More About UsArchives
- April 2024
- March 2024
- February 2024
- January 2024
- December 2023
- November 2023
- October 2023
- September 2023
- August 2023
- July 2023
- June 2023
- May 2023
- April 2023
- March 2023
- February 2023
- January 2023
- December 2022
- November 2022
- October 2022
- September 2022
- August 2022
- July 2022
- June 2022
- May 2022
- April 2022
- March 2022
- February 2022
- January 2022
- December 2021
- November 2021
- October 2021
- September 2021
- August 2021
- July 2021
- June 2021
- May 2021
- April 2021
- March 2021
- February 2021
- January 2021
- December 2020
- November 2020
- October 2020
- September 2020
- August 2020
- July 2020
- June 2020
- May 2020
- April 2020
- March 2020
- February 2020
- January 2020
- December 2019
- November 2019
- October 2019
- September 2019
- August 2019
- July 2019
- June 2019
- May 2019
- April 2019
- March 2019
- February 2019
- January 2019
- December 2018
- November 2018
- October 2018
- September 2018
- August 2018
- July 2018
- June 2018
- May 2018
- April 2018
- March 2018
- February 2018
- January 2018
- December 2017
- November 2017
- October 2017
- September 2017
- August 2017
- July 2017
- June 2017
- May 2017
- April 2017
- March 2017
- February 2017
- January 2017
- December 2016
- November 2016
- October 2016
- September 2016
- August 2016
- July 2016
- June 2016
- May 2016
- April 2016
- March 2016
- February 2016
- January 2016
- December 2015
- November 2015
- October 2015
- September 2015
- August 2015
- July 2015
- June 2015
- May 2015
- April 2015
- March 2015
- February 2015
- January 2015
- December 2014
- November 2014
- October 2014
- September 2014
- August 2014
- July 2014
- June 2014
- May 2014
- April 2014
- March 2014
