5 Best Free Fishbone Diagram Maker Software For Windows
Here is a list of Best Free Fishbone Diagram Maker Software for Windows. Using these freeware, you can easily create a Fishbone Diagram also known as Ishikawa Diagram or Cause and Effect Diagram.
While most of these Fishbone diagram freeware let you create your own Fishbone Diagrams using dedicated tools, others are office suites which let you import a desired Fishbone Diagram template to edit it. You can add a problem statement and its causes while inserting various objects like boundary, relationship, subtopics, callout, notes, labels, comments, hyperlinks, attachments, summary, image files, etc. In addition to that, you can add markers to particular cause like task priority, emojis, task progress, stars, flags, people, arrows, symbols, and more.
In all of these Fishbone diagram creator software, you get standard editing features to modify font, change style of different elements of the diagram, modify shape of objects, and do more. Also, you can customize background of the sheet with desired color or image. You can also create various organizational charts, mind maps, logic charts, tree charts, etc. using these software.
To export the created Fishbone diagrams, most of these Fishbone diagram software support HTML, PNG, BMP, JPEG, GIF, DOC, XML, ODT, Text, etc. formats.
My Favorite Fishbone Diagram Maker Software For Windows:
From the list, XMind is my favorite Fishbone diagram maker. It is a feature-rich freeware to create a Fishbone diagram. It provides several dedicated tools to do so, and also supports various file formats to export created Fishbone diagrams. Explore the list to know more about it.
You can also checkout the lists of best free Venn Diagram Maker, Drawing, Flowchart Maker, and Word Processor software for Windows.
XMind
XMind is a free mind mapping software for Windows. You can use this software to create Fishbone diagram a.k.a. ‘Ishikawa’ or “Cause and Effect” diagram.
To create Fishbone Diagrams in XMind:
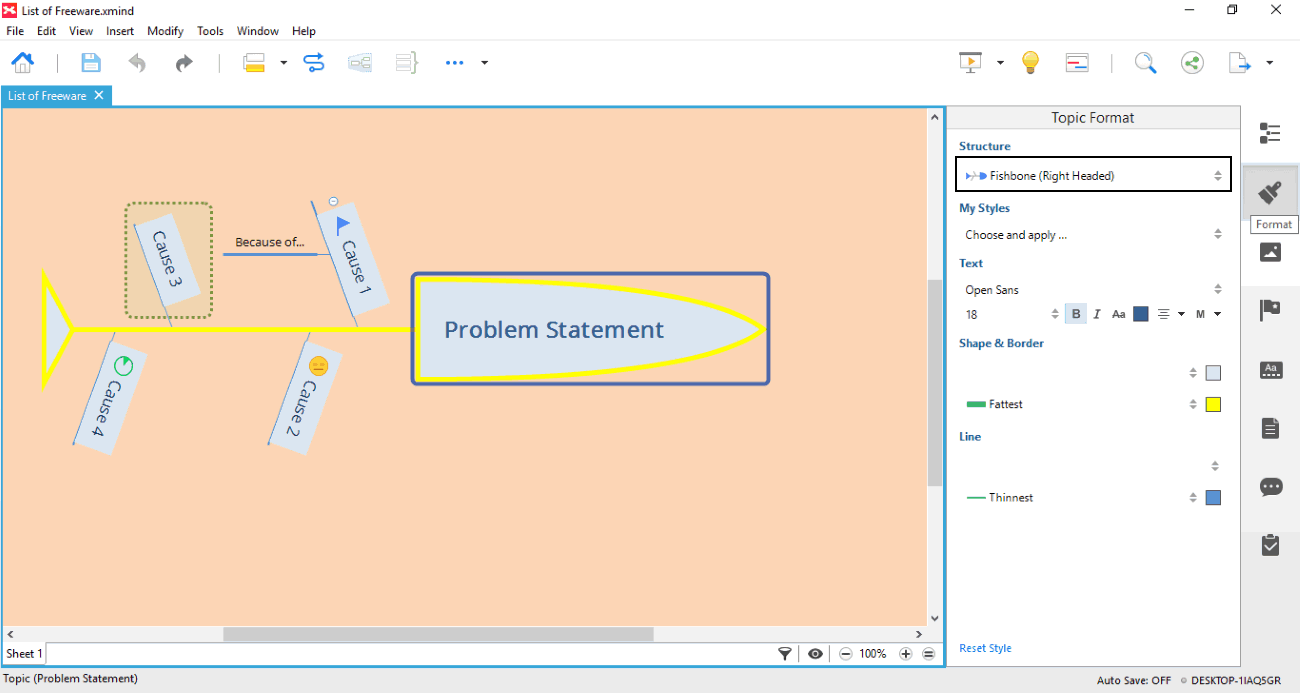
- First, open a blank sheet. You will see a text box named ‘Central Topic’. Here, you have to insert the actual problem statement to create an Ishikawa diagram.
- Now, click on that problem statement text box. A ‘Topic Format’ tab at right panel will open up (see full screenshot). There, you will see different parameters to define including Structure, My Style, Text, Shape & Border, and Line. From Structure’s drop-down menu, choose Fishbone (left headed or right headed). This will create a map in the format of Fishbone. You can also choose Fishbone structure by right-clicking on that problem statement text box, and going to Structure > Fishbone (left headed or right headed).
- You can now add causes of that problem you defined in the first step in form of Floating Topics (from Insert menu).
- In addition to above, you can insert subtopics, parent topic, topics before, callout, notes, labels, comments, hyperlinks, attachments, summary, image files, etc., to a particular cause topic. You can also create a boundary around a cause, and a relationship between causes of the problem.
- To further classify the causes of the problem, you can use Markers. These markers include Task priority, Faces (Emojis), Task Progress, Stars, Flags, People, Arrows, Symbols, Month, and Day of week.
- As a result, you’ll get a desired Fishbone diagram.
It also provides some Fishbone diagram themes which you can use accordingly. In the Outline tab at right panel, you can see content of the diagram, and manually edit the added topics. It also lets you modify the elements of the Fishbone diagram, like modifying line style, text, shape and border, etc. Not just that, you can also customize Sheet Format including the background color, wallpaper, and more.
To import a Fishbone diagram, it supports various file formats like Microsoft Word, FreeMind, NovaMind, Lighten, OPML, etc. You can save the Fishbone diagram in various formats including Image (PNG, BMP, JPEG, GIF), HTML, Text, SVG, etc. It also lets you print the created Fishbone diagram.
XMind is an open source Fishbone diagram maker software. It lets you create different mind map charts including matrix, organizational chart, balanced map, logic chart, tree chart, etc.
Note: There are many features which need upgrade to its Pro version, like Share via social networks, Task Info, Merge diagrams, etc.
MindOnTrack
MindOnTrack is another free mind mapping software, which also lets you create a Fishbone diagram. This Fishbone diagram creator includes most of the features of above mentioned freeware XMind.
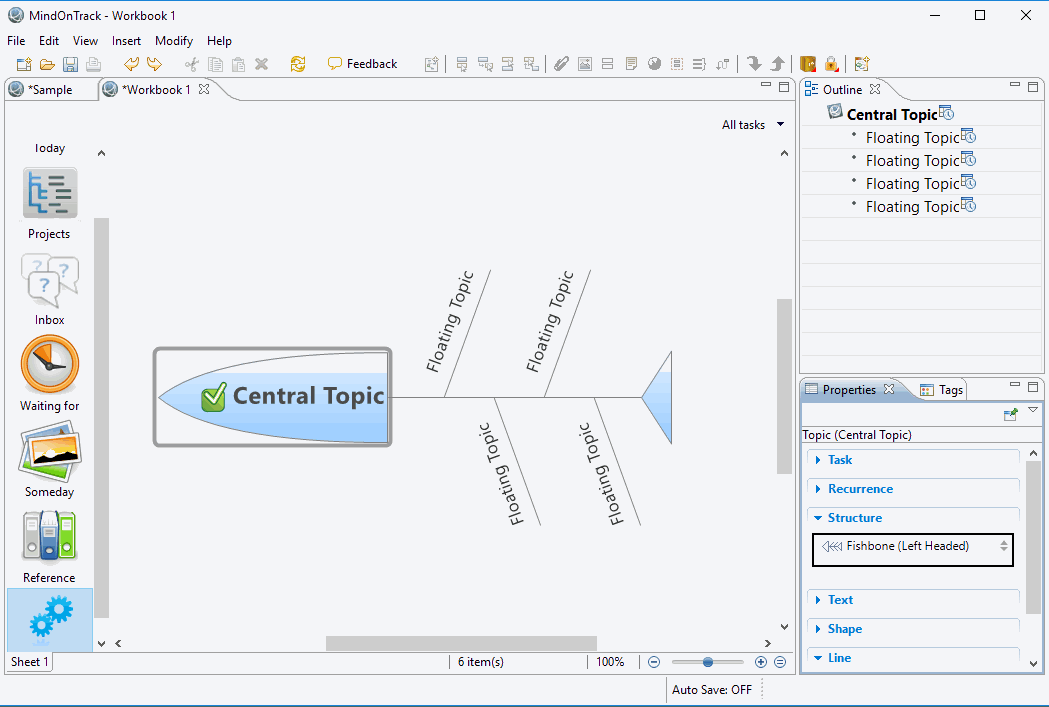
As you open a new workbook, you can either start with a blank sheet or select one from provided predefined templates or themes. For the latter one, choose “Cause & Effect” template to create a Fishbone diagram. It provides various tabs at left pane to organize information about a Fishbone diagram, including References, Waiting for, Inbox, Project, Mind Mapping, etc. You can later tag these working tab to a Fishbone diagram.
The Mind Mapping tab is the actual working area to design a Fishbone or Ishikawa diagram. In case you choose a blank map, you will see a text box named Central Topic, which defines the problem statement of the Fishbone diagram. Click on it and go to Properties tab at right panel. Here, select the structure as either left headed Fishbone or right headed Fishbone. After that, you can add as many floating topics in order to describe causes of the problem statement. From the Properties tab, you can define the problem statement and its causes by specifying task duration and recurrence with start and end time.
By right-clicking on a cause, you can insert subtopics, images (PNG, BMP, GIF, JPEG), relationship, boundary, attachment, summary, hyperlinks, labels, notes, etc. You can also add tags like At Work, Contact, At Home, Errands, Online, etc. You can add Notes too, to refer to in future. It lets you create multiple sheets within a running project.
You can also modify the shapes and style of the elements (topic, boundary, relationship) of the Fishbone diagram. Also, the background color of the sheet can be changed. The outline of the diagram can be viewed in the Outline tab.
You can export the current sheet in formats of Image (PNG, GIF, BMP, JPEG), HTML, FreeMind, Text, etc. To save a whole project, it supports XMind Workbook format.
MindOnTrack is a feature rich Fishbone diagram. It lets you sort the order of causes in a Fishbone diagram by their title, priority, or modified time. It provides spellcheck tool, auto save option, find and replace feature, and more. You can work on many projects at the same time and create many mind map charts.
OpenOffice
OpenOffice is a popular freeware which offers various office suites including Writer, Calc, Draw, Math, and more. Drawing Fishbone diagrams in this software is different than above Fishbone diagram maker software. It doesn’t provide a dedicated Fishbone diagram creator tool, but you can still create one. Let’s see how.
How to create a Fishbone diagram using OpenOffice:
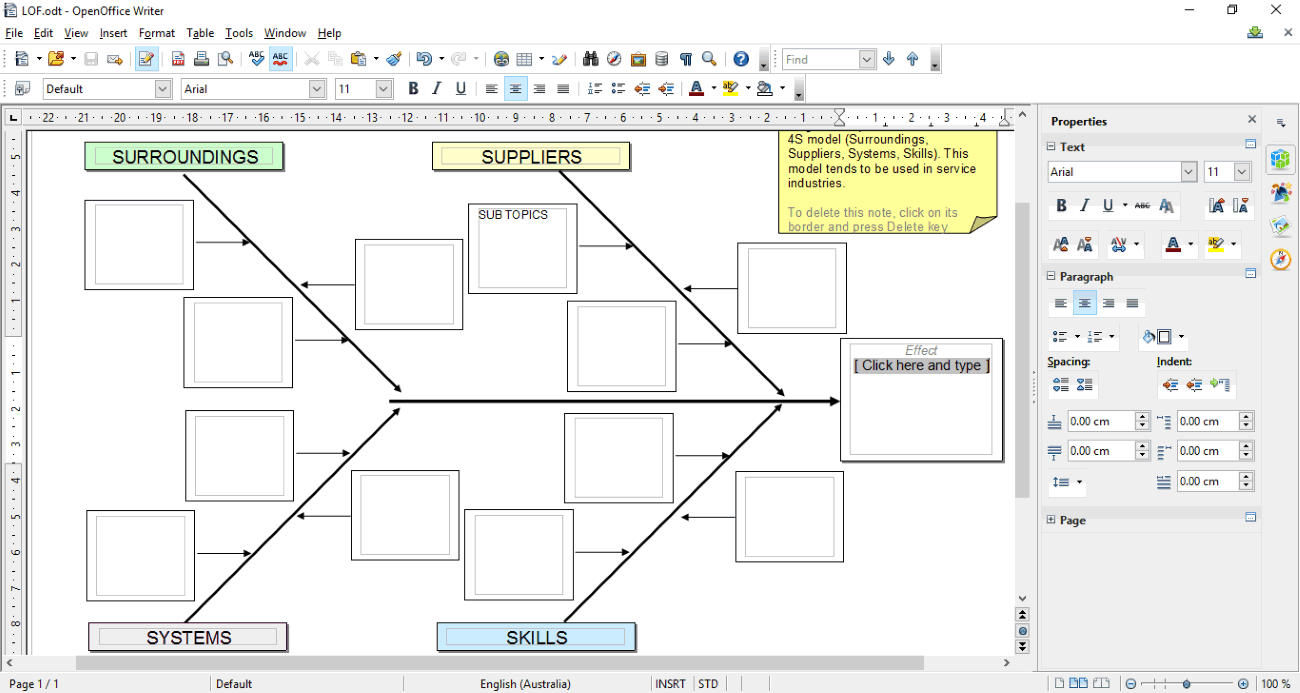
First and foremost, you have to search and download Fishbone Diagram Templates by going to aforementioned link. You can create a Fishbone diagram only by using these predefined templates. In my case, I downloaded a 4S model (Surroundings, Suppliers, Systems, Skills) to draw a Fishbone diagram (see full screenshot). After downloading the template, simply open it in this software. Now, you can make changes to the central topic or problem statement which is the Effect, and to its Causes (and their subtopics).
You can edit text within textboxes, change format, spacing, color, highlight text, etc. Using Gallery tab at right panel, you can add various icons, symbols, text shapes, background, etc. In addition, you can insert shapes (like arrow) in different styles. As it is an office tool, you get all standard features of word processor to apply modification on created Fishbone diagram.
You can export the Fishbone diagram in any of the supported format, including HTML, DOC, ODT, XML, etc.
So, this is how you can make use of a popular free office software as a Fishbone diagram maker.
LibreOffice
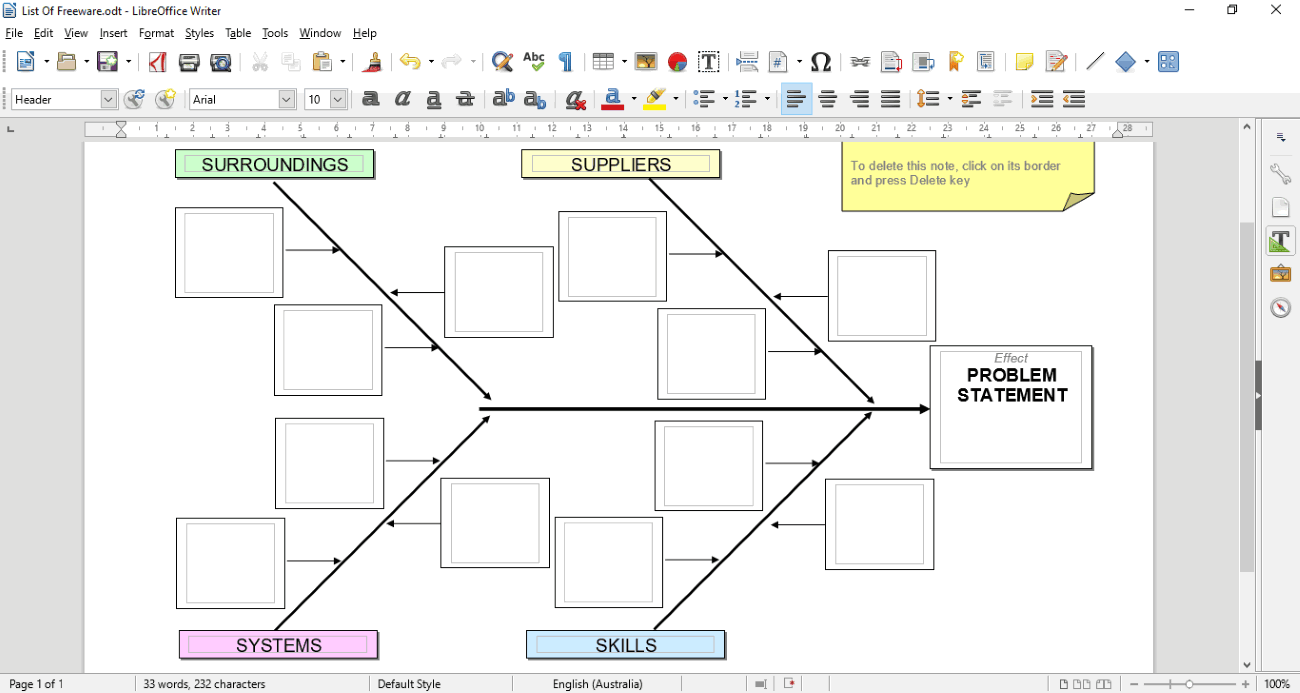
LibreOffice is another popular office software. To use it as a Fishbone diagram maker, you have to use the same steps as explained in OpenOffice. Simply download a suitable Fishbone diagram template from internet, import it to the software, and modify it accordingly to create a desired Cause & Effect Diagram. You can edit the text, format font, customize alignment, and do a lot more. You can also customize background of different causes, add different symbols, icons, bullets, arrows, etc. to them, highlight content, and do more.
To export a Fishbone diagram, you can use any of HTML, ODT, XML, RTF, DOC, TXT, etc. formats.
LibreOffice is a free office utility software. Apart from being a Fishbone diagram maker, it can be used to draw other diagrams using respective templates, create presentation, spreadsheets, and more. To know more about it, check here.
VUE
VUE is a free and open source tool to create maps. You can use it as a Fishbone diagram maker as well. It doesn’t provide dedicated tools to create a Fishbone diagram, but you can make use of provided tools in order to draw one.
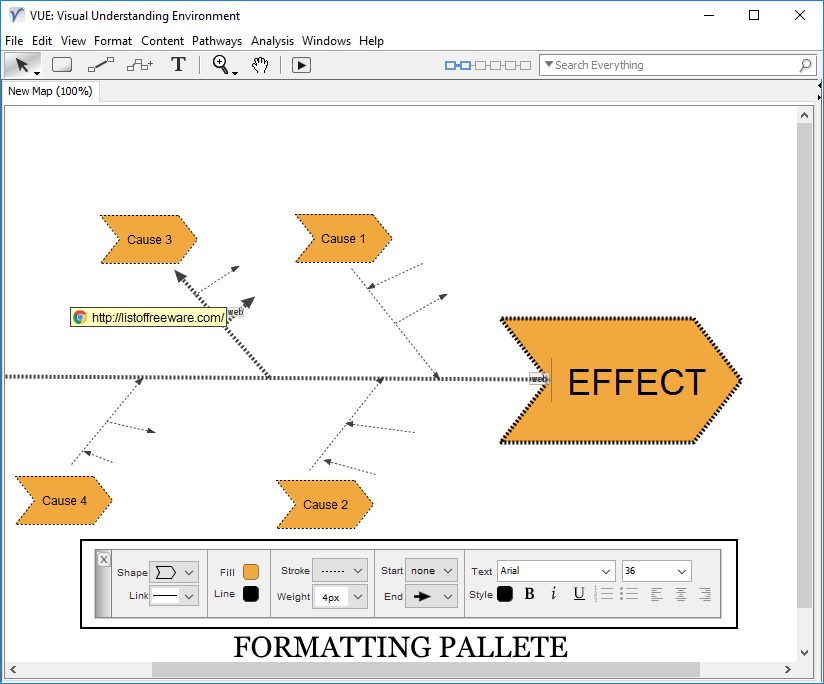
To create a Cause and Effect diagram using this software, simply add an ‘Effect’ (to define problem statement) and related ‘Causes’ nodes using Node tool provided on its interface. To link Effect with Causes, use Link tool provided on its interface. This way you can also create subtopic nodes of respective causes. You can add label to each nodes in desired text format.
You can also add hyperlink to the causes for reference purpose. It also lets you add an image to a specific node.
Using Formatting Palette (see full screenshot), you can modify shape of the nodes, link style, weight, color, etc. More tools including select, text, rapid prototyping, move, etc. are accessible from its interface.
You can check preview of created Fishbone diagram in presentation mode.
To save a Fishbone diagram, you can export it in formats of PDF, PNG, SVG, JPEG, RDF, XML, HTML, etc.
VUE is basically map creating software. You can generate map connectivity matrix, merge maps into one, and do more.


About Us

We are the team behind some of the most popular tech blogs, like: I LoveFree Software and Windows 8 Freeware.
More About UsArchives
- April 2024
- March 2024
- February 2024
- January 2024
- December 2023
- November 2023
- October 2023
- September 2023
- August 2023
- July 2023
- June 2023
- May 2023
- April 2023
- March 2023
- February 2023
- January 2023
- December 2022
- November 2022
- October 2022
- September 2022
- August 2022
- July 2022
- June 2022
- May 2022
- April 2022
- March 2022
- February 2022
- January 2022
- December 2021
- November 2021
- October 2021
- September 2021
- August 2021
- July 2021
- June 2021
- May 2021
- April 2021
- March 2021
- February 2021
- January 2021
- December 2020
- November 2020
- October 2020
- September 2020
- August 2020
- July 2020
- June 2020
- May 2020
- April 2020
- March 2020
- February 2020
- January 2020
- December 2019
- November 2019
- October 2019
- September 2019
- August 2019
- July 2019
- June 2019
- May 2019
- April 2019
- March 2019
- February 2019
- January 2019
- December 2018
- November 2018
- October 2018
- September 2018
- August 2018
- July 2018
- June 2018
- May 2018
- April 2018
- March 2018
- February 2018
- January 2018
- December 2017
- November 2017
- October 2017
- September 2017
- August 2017
- July 2017
- June 2017
- May 2017
- April 2017
- March 2017
- February 2017
- January 2017
- December 2016
- November 2016
- October 2016
- September 2016
- August 2016
- July 2016
- June 2016
- May 2016
- April 2016
- March 2016
- February 2016
- January 2016
- December 2015
- November 2015
- October 2015
- September 2015
- August 2015
- July 2015
- June 2015
- May 2015
- April 2015
- March 2015
- February 2015
- January 2015
- December 2014
- November 2014
- October 2014
- September 2014
- August 2014
- July 2014
- June 2014
- May 2014
- April 2014
- March 2014
