9 Best Free Quadratic Equation Grapher Software For Windows
Here is a list of best free Quadratic equation Grapher software for Windows. Through these software, you can plot graphs of Quadratic equations on a 2D XY-plane. Not just 2D, but some software are capable to plot 3D graphs as well. Most freeware can also plot graphs using Linear, Trigonometric, Cubic, etc. equations.
Use of these graphing software is pretty easy as you just need to enter a Quadratic equation to get the resultant graph. Not just one graph, but multiple graphs can also be generated by entering multiple equations in most software. In case of multiple graphs, these software allow you to assign different color schemes for different graphs to create a distinction between graphs. After completion, you can save the graph in a software specific project format or as a PDF.
Some equation graphers can also give you solutions of various mathematical problems like Trigonometry, Linear equations, Quadratic equations, etc. Plus, various common but essential tools like Zoom in/out, Pan, Graph lines, etc. are available in most software.
My Favorite Quadratic Equation Grapher Software For Windows:
Microsoft Mathematics is my favorite software because it can plot both 2D and 3D graphs of a Quadratic equation. It is also capable of plotting multiple graphs of different equations like Trigonometry, Cubic, etc. Plus, its property to provide step by step solution of various mathematical problems is also impressive.
You can also check out lists of best free Math Equation Editor, System Of Linear Equation Calculator, and Fibonacci Calculator software for Windows.
Microsoft Mathematics
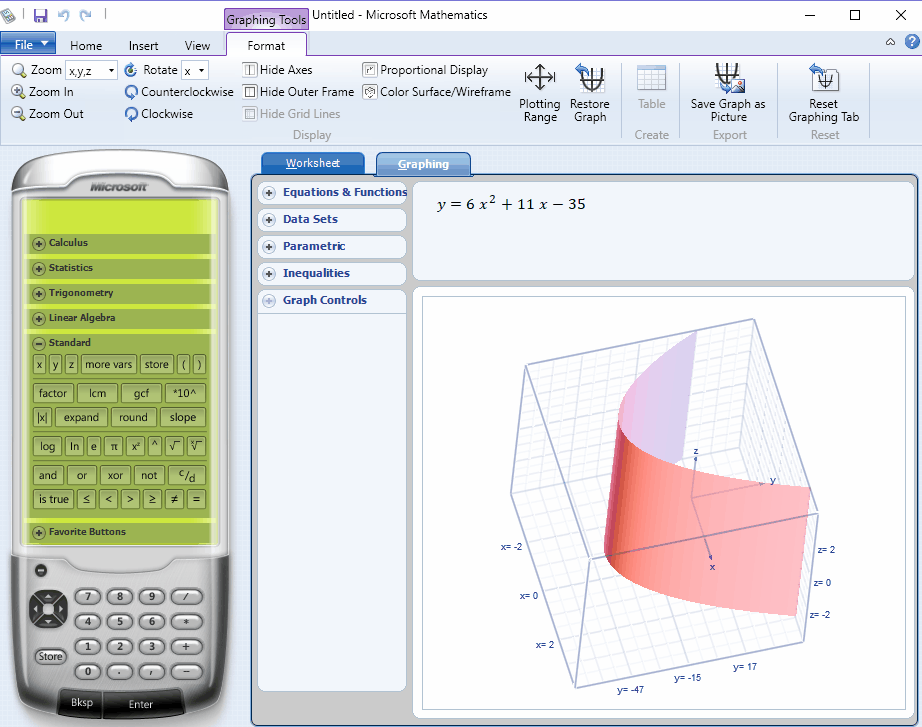
Microsoft Mathematics is a free quadratic equation grapher software for Windows. It is basically used to draw and solve graphs of various mathematical problems like Linear equations, Calculus, Trigonometry, Statistics, etc. It is also capable of drawing both 2D and 3D graphs of any equation. Also, its capability to give step by step solutions of input equations is really impressive.
How to graph a quadratic equation in Microsoft Mathematics:
On the main interface of this quadratic grapher, you can view two main sections namely, Worksheet and Graphing. In its Graphing section, you can enter one or more quadratic equations to get the output graphs of all equations. Usually, the graph of quadratic equations have the parabolic shapes that you can also notice on this software. To analyze plotted points over the graph, use the Worksheet section which contains the exact values of both X and Y coordinates. Now, to view the 3D graph, again go to Graphing section and change the dimension from 2D to 3D. Always remember to press the Graph button to view the output graph. In the 3D graph, you can change the orientation of the graph through your mouse. Plus, in both 2D and 3D graphs, you can use the mouse wheel to zoom in and zoom out.
After completion, you can save the step by steps results along with graphs as Microsoft Mathematics Worksheet (.gcw) format. It lets you print the graph as well.
GraphCalc
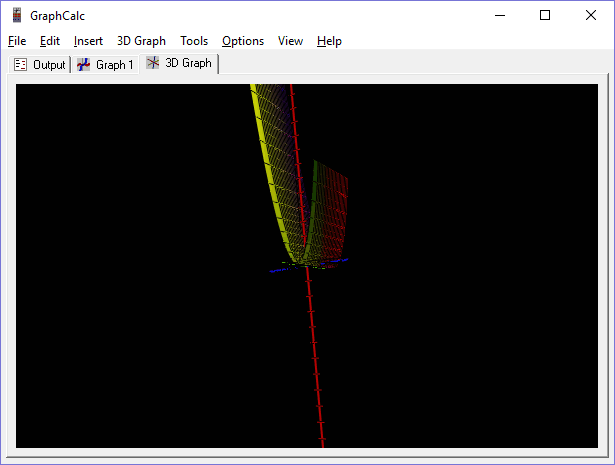
GraphCalc is a free and feature-rich quadratic equation grapher software for Windows. Using it, you can draw both 2D and 3D graphs of Quadratic, Linear, Cubic, Trigonometric, etc. equations. Not just graphs, but the complete solution of equations can also be obtained through it.
This software comes with a dedicated graph section where both 2D and 3D graphs are available. To draw a 2D graph, select the Graph 1 tab from the main interface. In this tab, 10 y(t) functions from y(1) to y(10) are present on the right side of the interface. Fill one or more y(t) functions with the quadratic or other supported equations to immediately get the graphs of respective equations on the XY-plane. Each y(t) function is coded with a different color, so you can quickly identify the graph of a specific equation. At any time, you can change the color of a function from the Graph options. The output graphs do not have any markings, still, you can use point cursor at any point of the graph to view its coordinates.
Similar to 2D graphs, you can easily draw 3D graphs as well by using the 3D graph tab. In this tab, you can enter the quadratic and other equations by accessing the 3D Graph menu > Options. At maximum, you can get the graphs of 6 different equations. Some other settings like the selection of colors, range, and axes can also be changed. After the setup, press OK button to view the 3D graphs. You can easily rotate and pan the graph through mouse to view it from all angles.
The resultant 2D and 3D graphs of the Quadratic equation can be saved as PDF file format.
Graph
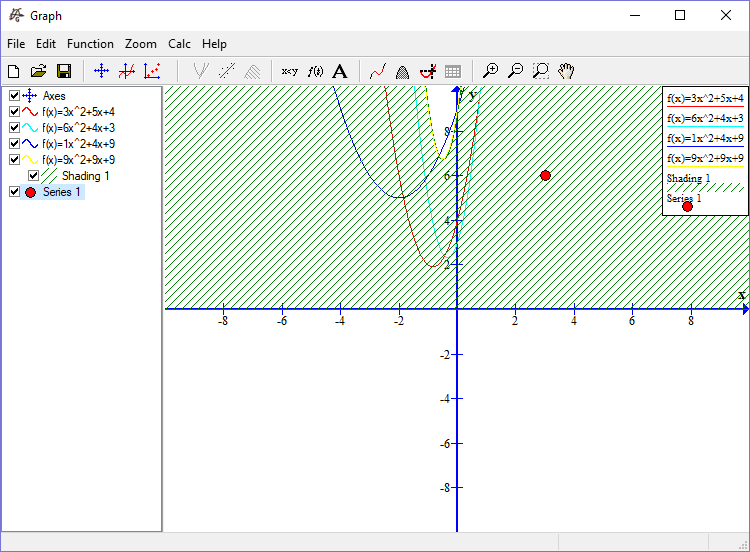
Graph is a free and open source Quadratic equation grapher software for Windows. It can also be used to draw graphs of various other mathematical functions or equations like Linear equations, Trigonometric functions, Cubic equations, and more.
In this software, you can draw multiple graphs on the same XY-plane by entering more than one Quadratic equations. Not just one type of equation, but two or more absolutely different equations like Linear, Trigonometric, and Quadratic equations on the same XY plane can also be drawn. And, you don’t need to select different equation types before entering the equations because it can self-identify the differences between equations by analyzing their structure. In case of multiple equations, you can assign a color scheme for each equation to quickly identify a particular graph. Besides color coding, there are some other handy features in it like Shading (to shade different parts of the graph), Series (to add colored dot on the graph), Label (to add text), Relation (to add relations between equations), etc.
Now, to plot graphs for Quadratic equations, go to Functions menu and select Insert function. In Insert Function, there is one Function equation field where you need to enter one equation at a time. Color coding option is also available in this menu, so select a color for the entered equation and click on OK button to view the graph on XY plane. Repeat the same process again to plot multiple graphs by entering more equations. After completion, you can save the final graph in various formats like SVG, BMP, JPG, PNG, etc.
ZGrapher
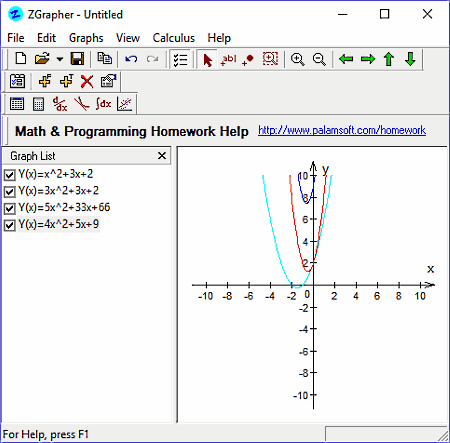
ZGrapher is a feature-rich graph generating utility software for Windows. Through it, you can generate graphs for various mathematical problems like Quadratic equations, Linear equations, Derivation, Integration, Regression, Tangents, and more. Like other similar software, you need to enter the Quadratic equation to this software to get the output graph. The graph plotted by this software is very well marked. Still, you get some additional tools to add labels and points to the graph as well.
This freeware also lets you plot multiple graphs on its XY-plane by entering multiple Quadratic equations. Plus, you can use different colors to differentiate each graph from each other from its Graph properties.
How to plot a graph using ZGrapher:
- Go to Graphs menu and select Add Graph option.
- Now, add Quadratic Equation to it and press OK to get the graph on the XY-plane.
- You can repeat the second point to plot more graphs on the XY-plane.
After completion, you can save the graph as an Image (BMP, GIF, and PCX) or as ZGrapher (.zgd) file.
Equation Analyzer
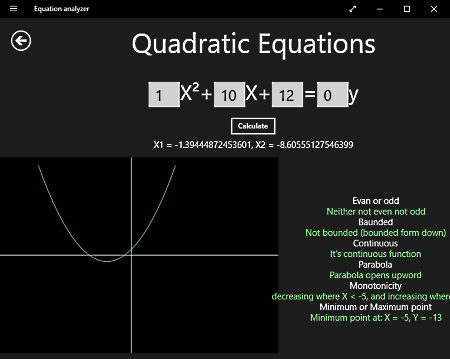
Equation Analyzer is a free quadratic equation grapher app for Windows 10. It is a very simple app that can plot a graph for any linear or quadratic equation.
When you launch this app, you can view only two main options namely, Linear Equations and Quadratic Equations. To plot a graph of a Quadratic equation, select the Quadratic Equation option and enter the equation. After that, press Calculate to view the resultant graph. Besides graph, it also clearly defines the meaning of graph by showing various graph parameters.
Graph Parameters provided by this software are:
- Even or Odd: To show whether the result is even, odd, not even, or not odd.
- Bounded: To let you know whether the graph is bounded or not.
- Continuous: To show function is continuous or not.
- Parabola: It shows whether parabola opens upwards or downwards.
- Minimum or maximum point: It shows minimum or maximum values of X and Y coordinates.
Similar to the Quadratic equation, you can plot the graph of linear equation by going to Linear equations option.
GeoGebra graphing Calculator

GeoGebra graphing Calculator is another free quadratic equation grapher app for Windows 10. This app can plot graphs using Quadratic, Linear, Trigonometric, and various other mathematical equations. Plus, it also allows you to enter multiple equations to plot their graphs on the same XY-Plane. To create a difference between graphs, this app automatically selects a different color for each graph.
The process of generating the graph is simple as you just need to enter equations in its Algebra section to get the respective graph. The unique property of this app is that it shows the graph in real time. That means as soon as you enter a single digit of the equation, it starts plotting the graph from that instance.
This app also comes with a lot of tools that you can use to further add various elements on the graph. Some of the useful tools of this software are:
- Basic Tools: These tools include move, point, slider, intersect, etc.
- Edit: It includes tools, like select objects, move graphics view, delete, show/hide label, and show/hide an object.
- Media: Using these tools, you can add an image and any text to the graph.
- Measure: This tool lets you measure an angle between two line segments, distance between two points of a line segment, and the area of a shape such as a circle.
After completion, you can save the graph as a project and also share it with others through Email and Onedrive.
WeissCalc
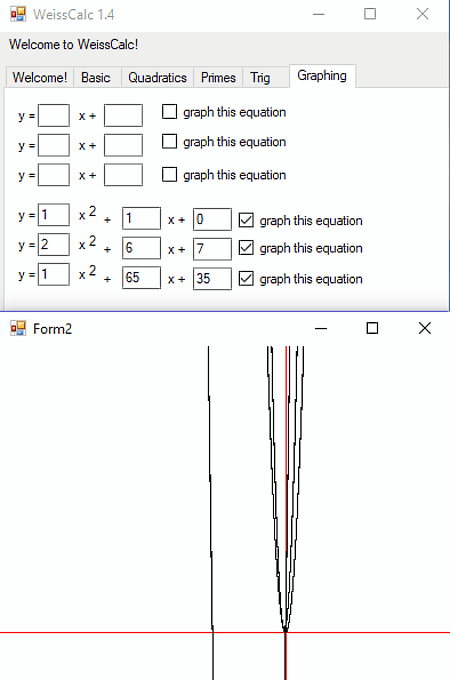
WeissCalc is a free and lightweight Quadratic equation grapher software for Windows. Using it, you can draw 2D graphs of both linear and quadratic equations. It is also capable of plotting multiple graphs for different linear and quadratics equation at a time. At maximum, you can plot graphs for 3 linear and 3 quadratic equations. It has a dedicated Graphing section into which you need to enter quadratic equations to get the respective graph. The graphs produced by this software are pretty accurate in terms of shapes, but they lack important markings (X and Y axis plot values). Plus, it is really hard to identify the graphs for different equations as all graphs use same color scheme.
Apart from graphs, you can also use this freeware as a basic calculator, quadratic equation solver, prime number checker, and Trigonometry function solver.
Quadratic Solver
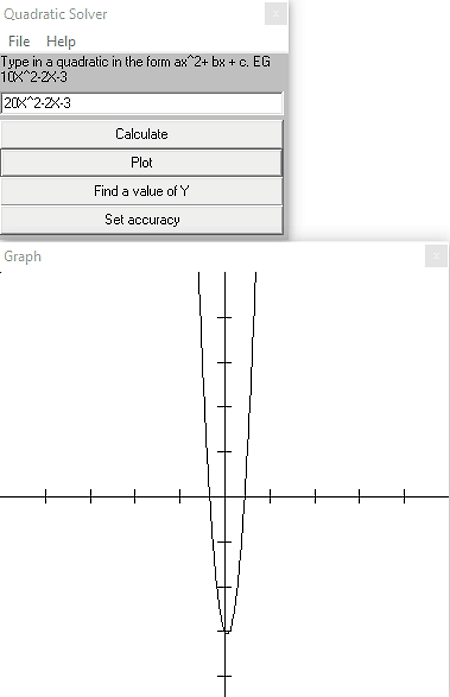
Quadratic Solver is another lightweight quadratic equation grapher software for Windows. It is a straightforward software that plots a graph according to the input quadric equation. Not just graph, it can also be used to get the solution of the equation as well as to find the value of Y by entering the value of X in the same equation.
To plot a graph, first, you need to enter a Quadratic equation to this software. After that, press the Plot button to view the graph. In the output graph, you can notice that it does not have any markings on both axes which is the main drawback of this software. Overall, it is a simple and easy software to get the quadratic equation graph.
Console Grapher
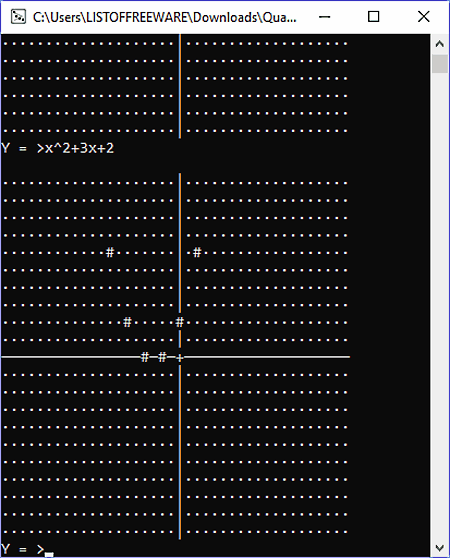
Console Grapher is a free and portable console-based Quadratic equation grapher software for Windows. It is a very lightweight software that you can carry around in a portable storage device and use on the go.
This software is capable of plotting graphs of various equation types like Quadratic, Linear, Cubic, Trigonometric equations, etc. When you launch this software, a console window will open up where you can enter one equation at a time. After writing the equation press Enter to view the resultant graph. In the output graph, you can notice that it contains very few points (#) to represent the shape of the graph, usually parabola in case of Quadratic Equations. Plus, the lack of markings is another letdown of this software. Through its output graph, you can get a hint of the overall shape of the graph but nothing more.
Overall, it a quite simple but also a very basic Quadratic grapher software with almost no additional features.


Naveen Kushwaha
Passionate about tech and science, always look for new tech solutions that can help me and others.
About Us

We are the team behind some of the most popular tech blogs, like: I LoveFree Software and Windows 8 Freeware.
More About UsArchives
- April 2024
- March 2024
- February 2024
- January 2024
- December 2023
- November 2023
- October 2023
- September 2023
- August 2023
- July 2023
- June 2023
- May 2023
- April 2023
- March 2023
- February 2023
- January 2023
- December 2022
- November 2022
- October 2022
- September 2022
- August 2022
- July 2022
- June 2022
- May 2022
- April 2022
- March 2022
- February 2022
- January 2022
- December 2021
- November 2021
- October 2021
- September 2021
- August 2021
- July 2021
- June 2021
- May 2021
- April 2021
- March 2021
- February 2021
- January 2021
- December 2020
- November 2020
- October 2020
- September 2020
- August 2020
- July 2020
- June 2020
- May 2020
- April 2020
- March 2020
- February 2020
- January 2020
- December 2019
- November 2019
- October 2019
- September 2019
- August 2019
- July 2019
- June 2019
- May 2019
- April 2019
- March 2019
- February 2019
- January 2019
- December 2018
- November 2018
- October 2018
- September 2018
- August 2018
- July 2018
- June 2018
- May 2018
- April 2018
- March 2018
- February 2018
- January 2018
- December 2017
- November 2017
- October 2017
- September 2017
- August 2017
- July 2017
- June 2017
- May 2017
- April 2017
- March 2017
- February 2017
- January 2017
- December 2016
- November 2016
- October 2016
- September 2016
- August 2016
- July 2016
- June 2016
- May 2016
- April 2016
- March 2016
- February 2016
- January 2016
- December 2015
- November 2015
- October 2015
- September 2015
- August 2015
- July 2015
- June 2015
- May 2015
- April 2015
- March 2015
- February 2015
- January 2015
- December 2014
- November 2014
- October 2014
- September 2014
- August 2014
- July 2014
- June 2014
- May 2014
- April 2014
- March 2014
