6 Best Free Stock Analysis Software For Windows
Here is a list of Best Free Stock Analysis Software For Windows. Using these freeware, you can easily get updated data on major stock markets including American (NYSE, NASDAQ, etc.), Asian (BSE, HKEX, etc.), European (ATX, FTSE, DAX, etc.), Australian (ASX), etc. In some of these, you even get to view information on all components of a particular stock exchange. While some of these stock market analysis software provide real-time data on the activities in stock markets, others let you access recently updated stock market data over a time period. You can view data for a particular time duration too like 1 month, 6 months, 1 year, and so on.
A graphical representation of stock market data is provided in all these stock market analysis tools. You get information like values of low, high, change, % change, volume, open, close, buy, buyer quantity, sell, seller quantity, etc. These free stock market software also let you add technical indicators to have elaborated data such as Average True Range, Simple Moving Average, Exponential Moving Average, Relative Strength Index, OBV, Rate Of Change, Volume, Price Channels, Price and Volume Trends, etc. Some of these also provide some handy features like watchlist management, portfolio management, etc.
Overall, these software are very helpful in the evaluation of stock markets for the traders.
My Favorite Stock Analysis Software For Windows:
I have quite a few favorites among these stock market analysis software. I would keep StockwareLite at the top because it provides market information on various stock exchanges including NYSE US, NSE-ALL, AMEX US, ASX Australia, KLS Malaysia, OSLO Norway, etc. Plus, it also lets you manage your watchlist and portfolio.
myTrades is also a good stock market analysis tool. It is a Windows 10 app for stock market analysis. Along with stock market exchanges, you get information on all components of each of them.
You may also like some best free Portfolio Management and Lead Management software for Windows.
StockwareLite
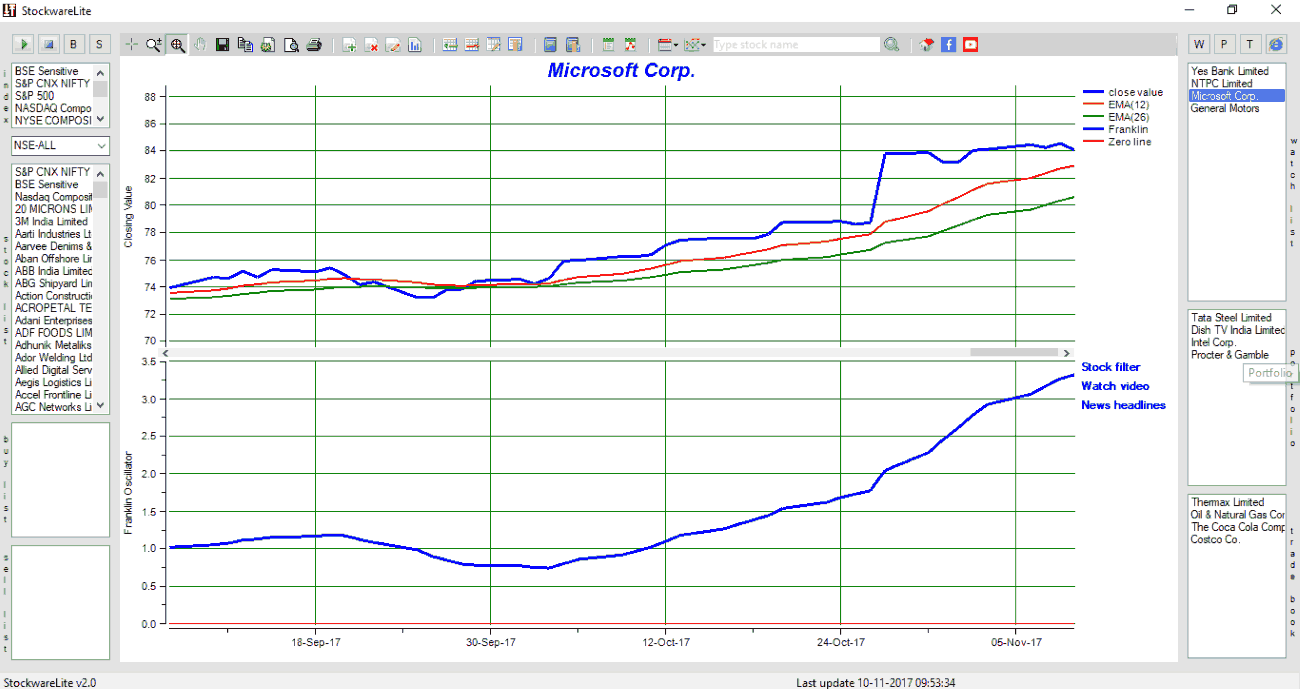
StockwareLite is a free stock analysis software for Windows. It can be used for stock market analysis and portfolio management. It uses Franklin Oscillator as a technical indicator for stock market analysis.
In this stock market analysis software, all the main tools are available on the main interface itself. To analyze market data, you can choose a database from the index list (NYSE Composite, Euronext 100, BSE Sensitive, FTSE 100, etc.) and select a stock exchange (NYSE US, NSE-ALL, AMEX US, ASX Australia, KLS Malaysia, OSLO Norway, etc.). Now, choose a stock market from the stock list as per the selected stock exchange. For example, for NYSE US, you can perform stock market analysis for ALCOA, ABB LTD, Eaton Corporation, BlackRock, Black Hills Corporation, Cascade, Comerica Incorporated, etc. As you click on a stock market, you can see a graph with wave patterns with close value, Exponential Moving Average (EMA), Zero Line, etc. in different color schemes. Franklin trend, last date, last trade, day open, day high, etc. information are also shown.
You can also read the latest stock market news by clicking on News headlines button.
Other features of this stock market analysis software:
- By right-clicking on the chart, a context menu opens up. Simply go to Change Plot > Change Period option to change the time period for data you want to view, like 1 month, 3 months, 6 months, 1 year, 2 years, etc. Or, you can change plot to Price Rate of Change, Stochastic Oscillator, Aroon Oscillator, etc.
- You can add a stock to watchlist with date and its latest price. Also, you can add a stock to the portfolio with stock’s date, purchase price, and purchase quantity.
- It lets you edit and manage your watchlist and portfolio.
- You can see the status of your watchlist and portfolio in the form of graph or table.
- Also, you can see the tradebook status.
Many of features in StockwareLite are disabled because those features require an upgrade to its paid version named StockwarePro. These functions include Start Stock Filter, Intraday Charts, etc.
JStock

JStock is a free and open source stock analysis software for Windows. It is one of the simplest stock market analysis tools in this list. Different tabs to have a watch over stock markets are available on the main interface. The main tool for stock market analysis is Stock Watchlist. Let’s check out its functionalities.
- Here, you can search for a stock market from Stock search box and add it to the watchlist to analyze related market activities. As per its claim, it contains information on 36 stock markets from America, Africa, Asia, Australia, and Europe. Some of the major stock markets include DOW JONES, NASDAQ, TSX, SENSEX, AEX, JSE, etc. As you type initials of a stock, the suggestions for stock exchanges are displayed. So, you can easily choose the one you want to add. It lets you add multiple stock markets to the Stock Watchlist. You can also create customized stock watchlists.
- The real-time information fetched regarding the corresponding stock includes Code, Symbol, Buy, Buyer Quantity, Sell, Seller Quantity, High, Low, Change, % Change, Fall Below, Rise Above, etc. values. These information are provided on the main interface itself.
- On clicking a stock market, you can view data over a time period (last week, month, year, etc.) in a separate window (see full screenshot). This data is represented by price, volume, and Commodity Channel Index (CCI) graph. On hovering mouse over a particular date, you can see stock market information like Open, High, Low, Volume, Close, 14w CCI, etc. From Technical Analysis menu, you can choose a particular indicator for graphical representation. These indicators include EMA, SMA, RSI, MFI, and CCI. You can select Price Volume or Candlestick as the type of chart. JStock provides the flexibility to save this graphical data in CSV or XLS format. As it suits you, it lets you change the theme (Dark or Light) of the graph window.
Apart from above-mentioned features, it provides tools like Stock Indicator Scanner, Stock Indicator Editor, Portfolio Management, DriveWealth Trading, etc.
JStock is another great stock analysis software for Windows. It also supports other languages apart from English, including Chinese, French, German, and Italian. You can also change the interface skin. It is available as an Android app too.
myTrades
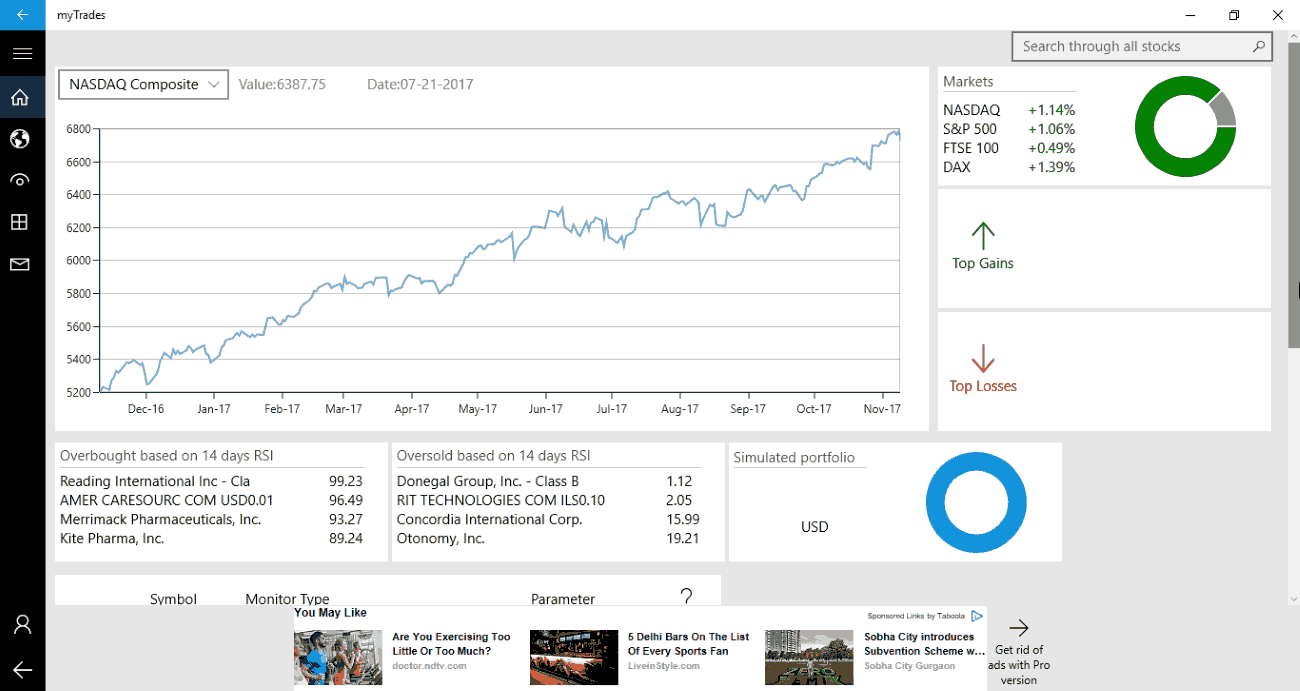
myTrades is a free stock analysis app for Windows 10. It is an advanced stock market analysis tool which provides live news and updates on global stock markets. You need to signup to use this stock analysis app. The login credentials are required whenever you restart this app.
On the main screen, you can see a graphical representation of a stock market with date and value. There are also information including “top overbought stocks based on 14 days RSI“, “top oversold stocks based on 14 days RSI“, simulated portfolio, triggered notifications, etc.
The main module for stock market analysis is Markets where you can access information on a particular stock market. It contains stock information for regions including Americas (Dow Jones Industrial Average, S & P 500, Nasdaq Composite), Asia-Pacific Economic Cooperation (Hang Seng Index), and European, Middle Eastern & African (ATX, CAC, FTSE, DAX). On clicking a stock market, you can view its components. For example, for Nasdaq Composite, you get information about its various components which include Advanced Accelerator Application, AAON, Axcelis Technologies, Amazon.com, BroadSoft, and many more. Furthermore, if you click on a component, you get a detailed stock market graphical report with values for open, close, high, low, date, volume, p/e ratio, etc. You can also select a time range for which you want to analyze stock market data (3/6 months or 1/3/5/10/max years). In the same window, at the bottom panel, you will see technical indicators like Ultimate Oscillators, Average True Range, Simple Moving Average, Exponential Moving Average, Relative Strength Index, etc. too.
Overall, myTrades is simple and effective stock market analysis tool for Windows.
ChartNexus
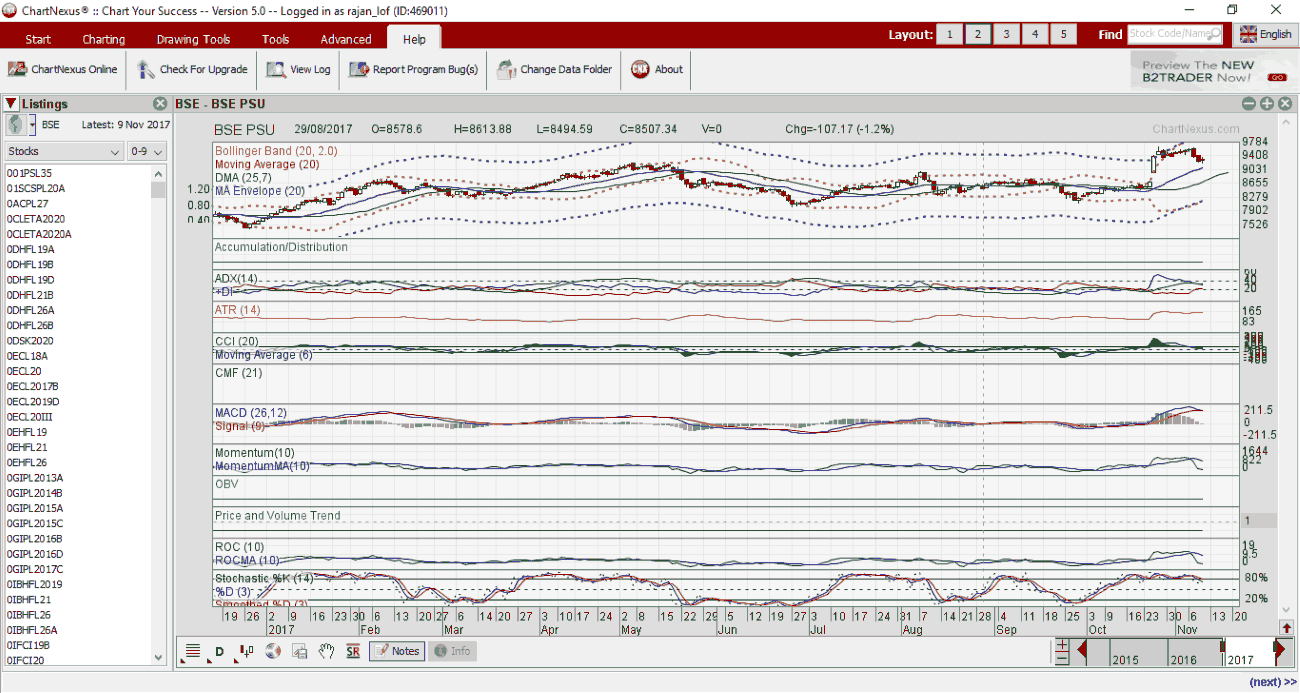
ChartNexus is another stock analysis software for Windows. To use it, you need to register an account which is for free.
The small windows on the left pane let you specify following parameters to view specific stock market information:
- Listings: Choose a stock exchange from the available list which includes BSE, NSE, NYSE, AMEX, NASDAQ, HKSE, JSX, SSE, etc. Now, you can select stock, indices, top volumes, % gainers, and/or % losers to analyze market data. There is a filter option too which lets you filter aforementioned stock markets based on an alphabet or 0-9 numbers.
- Indicators: You can choose particular indicators for technical analysis of stock markets. These indicators include Accumulation/Distribution, Average Directional Index, Bollinger Band, Chaikin Money Flow, Force Index, Moving Average, OBV, Rate Of Change, Volume, Price Channels, Price and Volume Trends, and more. The information like change, low, high, volume, etc. can be viewed on the top of the graph.
For latest information, you will have to keep updating EOD market data by using Download Market Data tool.
Using Watchlist, you can quickly access global indices and recently viewed stock markets. You can also add custom names to the watchlist and even export the list as a text file.
It lets you view technical analysis as well as performance charts of a stock market over a time duration in different windows. In both these windows, you get tools like move chart, change color, show recent support and resistance line, save chart to workspace, etc. These tools make stock market analysis rather easy. From Drawing Tools menu, you can use tools (pencil, shapes, text, etc.) to annotate these graphs.
Some other features of this stock analysis software:
- There is also a Notes tool which lets you write notes while analyzing stock market data, which can be later retrieved if needed.
- A Calculator present under Tools menu can be used as a spread calculator or risk-reward ratio calculator. In spread calculator, you need to input values of cost of shares (buy or sell) with price, step size, and number of shares. For risk-reward ratio, you need to mention investment strategy (long/short), current price, stop-loss price, and profit-taking price.
- It provides some other handy features like change layout, capture chart (PNG), print chart, etc.
Note: ChartNexus provides data for only BSE and NSE stock exchanges for free. To have information on more stock markets, you need to purchase separate market data for respective stock exchange.
Incredible Charts
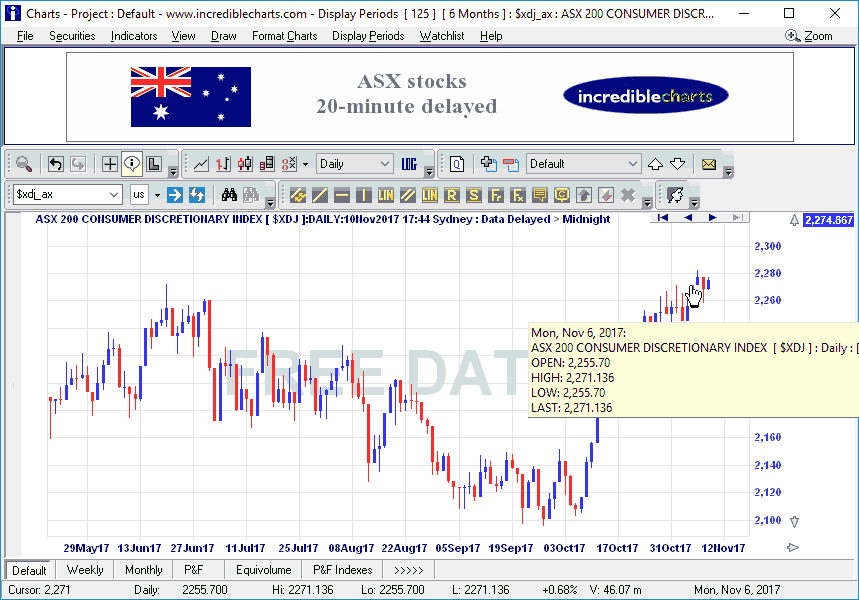
Incredible Charts is a technical analysis software for stock market. The free edition of this software also contains a 30-day trial for premium data (NYSE, NASDAQ, OTCBB, TSX, ASX, LSE, etc. stock markets data). After the trial period, you need to buy the pro version in order to access the aforementioned stock market data. In this free version, you can have access to World Indices and Commodities without time restriction.
Go to Securities > World Indexes option to access available stock market data including Indian BSE, FTSE, Germany DAX, Madrid General Index, Singapore Straits Times Index, Japan Nikkei Index, etc. As you choose a market, you will be able to see data as a graph for a time duration. You can change this time duration by choosing a time period from Display Periods menu. On hovering mouse over a particular date in the graph, you can see information like open, high, low, last, etc. By drawing a trendline in the graph, you can see value, % change, calendar days, trading days, etc. You can choose a technical indicator too from the provided list including price differential, price ratio, price comparison, average true range, CCI, force index, median price, momentum, moving averages, negative volume index, etc.
From the View menu, you can select Logarithmic Price Axis, Chart Interval, Line/Bar Type (OHLC, Close, Candle, etc.), Chart Cursor, Legend, Invert Vertical Axes, etc.
Some other features offered by Incredible Charts are: Watchlist, Format Chart (modify color schemes, font size, etc.), Import and Export files (IncredibleCharts files), Print, Save Chart as Image (BMP, PNG), etc.
moneycontrol.com
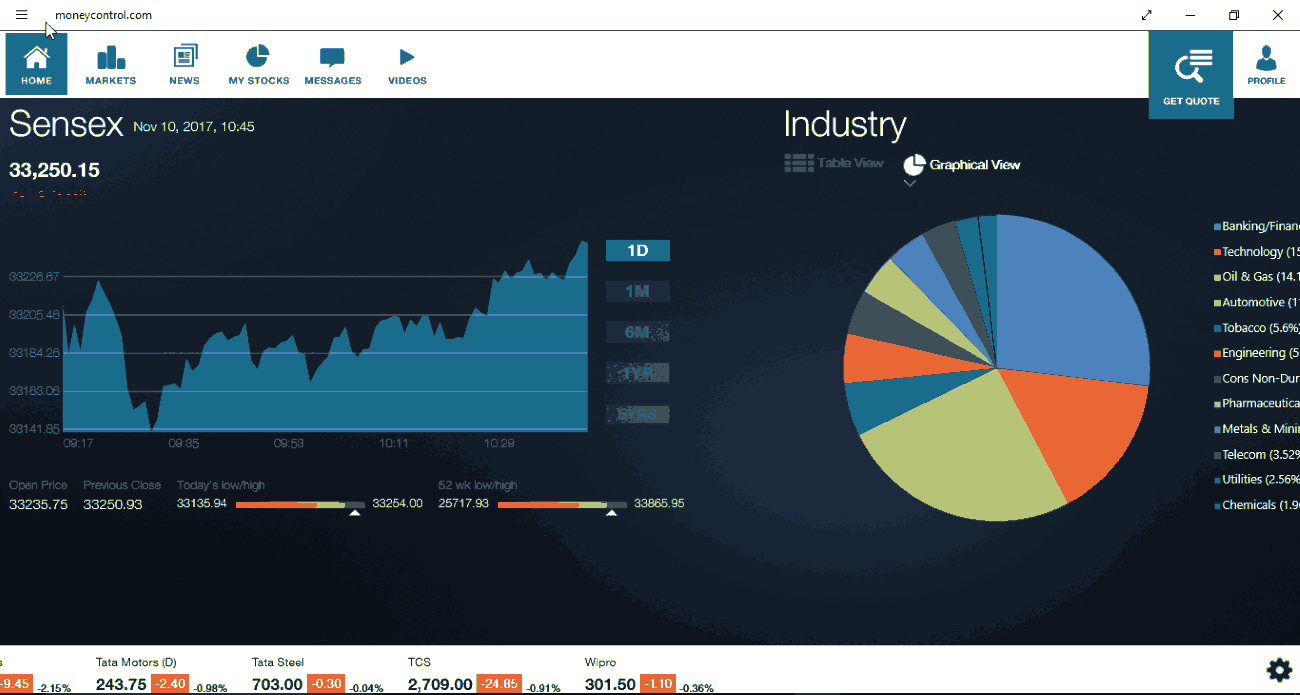
moneycontrol.com is a Windows 10 app for stock market analysis. It is mainly designed to provide real-time news on Indian stock market, but also gives updates on the global stock market (US, European, and Asian markets).
The main screen has markets module including Indian Indices, Global Indices, and Market Movers. Here, you can view live update on aforementioned stock markets with information like Opening Price, Today’s High/Low, Previous Close, etc. with a graph.
- The current information about Indian stock markets is displayed in Indian Indices, while you can view information on global stock exchanges like Nasdaq, FTSE, CAC, DAX, Straits Times, Hang Seng, etc. in Global Indices. Also, you can view Currency info, Mutual Funds, and Commodities.
- Market Movers module contains information which includes top gainers, top losers, 52w high/low, and active by volume/value for NSE and BSE stock exchanges.
Click on a particular stock market and then hit Detailed View button to have an elaborated graphical and tabular view with shares information. The news highlights of the current day are also shown on the main screen.
For the traders from India, moneycontrol.com is a good stock market analysis app. It provides a Portfolio Manager feature too, but you will need to register an account for that. Registration is free.


About Us

We are the team behind some of the most popular tech blogs, like: I LoveFree Software and Windows 8 Freeware.
More About UsArchives
- April 2024
- March 2024
- February 2024
- January 2024
- December 2023
- November 2023
- October 2023
- September 2023
- August 2023
- July 2023
- June 2023
- May 2023
- April 2023
- March 2023
- February 2023
- January 2023
- December 2022
- November 2022
- October 2022
- September 2022
- August 2022
- July 2022
- June 2022
- May 2022
- April 2022
- March 2022
- February 2022
- January 2022
- December 2021
- November 2021
- October 2021
- September 2021
- August 2021
- July 2021
- June 2021
- May 2021
- April 2021
- March 2021
- February 2021
- January 2021
- December 2020
- November 2020
- October 2020
- September 2020
- August 2020
- July 2020
- June 2020
- May 2020
- April 2020
- March 2020
- February 2020
- January 2020
- December 2019
- November 2019
- October 2019
- September 2019
- August 2019
- July 2019
- June 2019
- May 2019
- April 2019
- March 2019
- February 2019
- January 2019
- December 2018
- November 2018
- October 2018
- September 2018
- August 2018
- July 2018
- June 2018
- May 2018
- April 2018
- March 2018
- February 2018
- January 2018
- December 2017
- November 2017
- October 2017
- September 2017
- August 2017
- July 2017
- June 2017
- May 2017
- April 2017
- March 2017
- February 2017
- January 2017
- December 2016
- November 2016
- October 2016
- September 2016
- August 2016
- July 2016
- June 2016
- May 2016
- April 2016
- March 2016
- February 2016
- January 2016
- December 2015
- November 2015
- October 2015
- September 2015
- August 2015
- July 2015
- June 2015
- May 2015
- April 2015
- March 2015
- February 2015
- January 2015
- December 2014
- November 2014
- October 2014
- September 2014
- August 2014
- July 2014
- June 2014
- May 2014
- April 2014
- March 2014
