5 Best Free PID Simulator Software For Windows
This article contains a list of Best Free PID Simulator Software For Windows. PID are three terms, where P is proportional, I is integral, and D is derivative. These listed freeware are used in the field of industrial control system to simulate various applications and techniques using a PID controller. A PID controller basically determines error value and apply correction to the control functions. You can know more about PID controllers by going to aforementioned link.
These software take values of PID, set-point, feedback mode, drift angle, iterations, simulation speed, etc. as input parameters. Some parameters vary for different PID simulators based on the scenario used. For example, one of these can be used for different applications like multi-loop PID compressor control, liquid-liquid extraction holdup control, Digester Kappa observer using Smith Predictor, etc. Based on the specified parameters, these software plot graphs with representation of control output. In one of these, you can save the output graph or print it too.
Most of these are portable PID simulators. Hence, you don’t need to go through an eventful installation process to access their functionalities. Just run the application file and use these software on the go.
My Favorite Free PID Simulator Software:
RTC-simulator is my favorite PID simulator as it lets you use PID controller for multiple scenarios such as multi-loop PID control of a dosing tank, flow control based on measured step responses, and more.
You may also like some best free PLC Software, Laplace Transform Calculator, and Gas Simulation Software for Windows.
RTC-simulator
RTC-simulator, where RTC stands for Real Time Control, is a free simulator for distinct applications and techniques like Dynamic Matrix Control, Smith prediction, Kalman filtering, Advanced Level Control, etc. You can use PID controller tuning with a few of these applications, which are:
- Multi-loop PID control of a dosing tank.
- Multi-loop PID compressor control.
- Tank level controllers based on measured step responses.
- Liquid-liquid extraction holdup control.
- Flow control based on measured step responses.
- Digester Kappa observer using Smith Predictor.
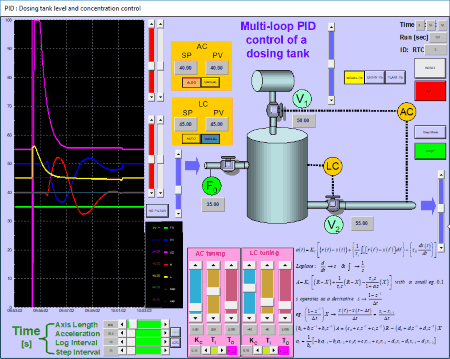
I have used “Multi-loop PID control of a dosing tank” application for testing purpose. Let’s see how to simulate PID controller with this case.
- Launch RTC-simulator and go to Application > PID option. It will open up an application window for “Dosing Tank”. You will see various options, parameters, tank diagram, and graph sections in this window. A Laplace equation is also given on the interface. The graphical representation takes place in real time with control functions.
- You can manually customize parameters like AC tuning and LC tuning (controller gain, controller’s derivative time constant, controller’s integrator time constant), SP (Set Point), PV (Process Variables), feedback mode (model, entry, or plant), etc.
- For the graphical representation, you can customize axis length, acceleration, log interval, and step interval.
- It provides step simulation option too which lets you analyze the graph for each point of time.
RTC-simulator is a nice and portable PID simulator.
Robot Simulator
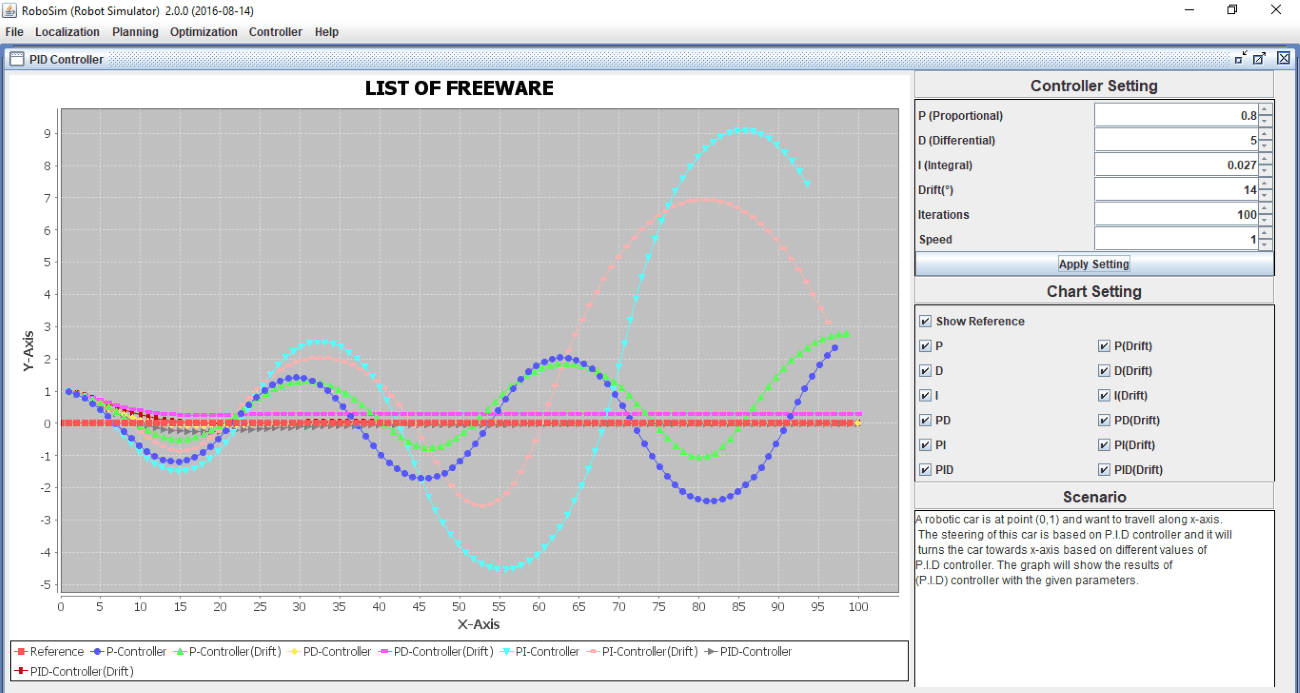
Robot Simulator is a free software to visualize and simulate concepts of Artificial Intelligence and Robotics. To do so, it comes with various modules like Localization (Histogram Filter, Kalman Filter, Particles Filter), Path Planning (DFS, BFS, Dynamic Programming), etc. It also provides a PID Controller for PID simulation, which is accessible from Controller menu. This PID controller is used to simulate a scenario where a robotic car is traveling along x-axis. The full detail of the scenario is given on the screen (click on above screenshot).
Robot Simulator as PID SImulation Software:
As you open PID Controller window, you will see the Controller Settings. Using these settings, you can configure parameters for PID simulator including values of P (proportional), I (Integral), D (differential), Drift angle, Iterations, and Speed. After setting up these parameters, click on Apply Setting and visualize the PID graph. You can choose the functions to include in the output graphical representation, such as Reference, P-controller, PD controller, PI controller, PID controller, etc. Different color schemes for distinct values are used to represent the graph. Hence, it is easy to analyze the PID graph.
On right-clicking the graph, you can customize its properties like title of the graph, plot settings (label, tick labels, range values, etc.), font, outline stroke, outline paint, background color, orientation, etc. You can zoom in/out the graph, copy PID graph to the clipboard, save it as a PNG image, and also print it.
Robot Simulator is another good PID simulation software which comes in a portable package.
PID Simulator
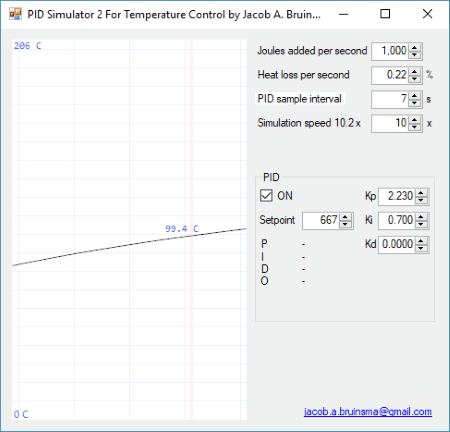
PID Simulator is a free software for PID tuning for temperature control. It plots a real-time temperature graph for adjustable parameters. You can change the values for parameters like heat loss per second, joules added per second, setpoint, constant values (Kp, Ki, Kd), etc. You can also set PID simulation speed and interval. The graph with temperature value is displayed on the screen.
It is a simple and portable PID simulation software.
PID simulator
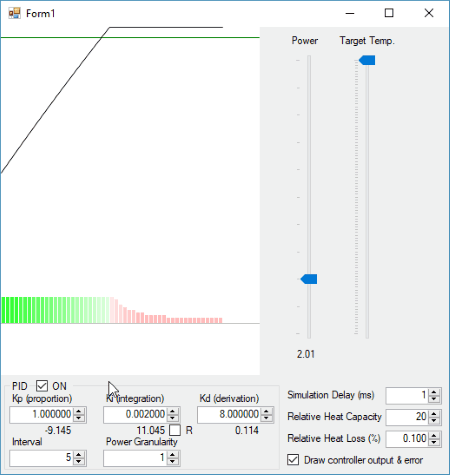
PID simulator is yet another PID simulation software for Windows. It is almost similar to above mentioned software. You just need to input the three constant values (proportion, integration, derivation), relative heat capacity and heat loss, dump heat, power granularity, target temperature, interval, simulation delay, etc. The fluctuating power value with controller output and error is displayed on the graph.
It is also a portable application.
PID example
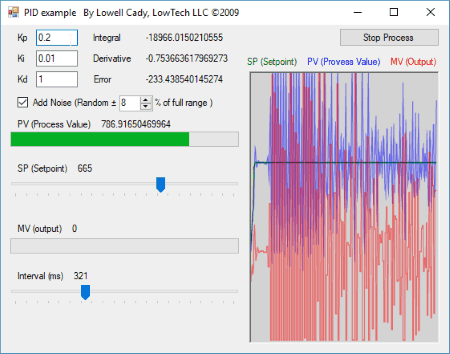
PID example is another free PID simulator for Windows. It is basically an example of PID control in the case where processes change due to inertia. Here, you can view real-time PID simulation graph. The values of three constants (Integral, Derivative, Error) are determined and displayed in real time on the interface. You can also change these values plus adjust Setpoint and Interval (ms) values to simulate and plot the PID graph. The graph plots the values of PV (Process Value) and MV (output) which you can analyze. If you want, you can add noise to the signal.


About Us

We are the team behind some of the most popular tech blogs, like: I LoveFree Software and Windows 8 Freeware.
More About UsArchives
- April 2024
- March 2024
- February 2024
- January 2024
- December 2023
- November 2023
- October 2023
- September 2023
- August 2023
- July 2023
- June 2023
- May 2023
- April 2023
- March 2023
- February 2023
- January 2023
- December 2022
- November 2022
- October 2022
- September 2022
- August 2022
- July 2022
- June 2022
- May 2022
- April 2022
- March 2022
- February 2022
- January 2022
- December 2021
- November 2021
- October 2021
- September 2021
- August 2021
- July 2021
- June 2021
- May 2021
- April 2021
- March 2021
- February 2021
- January 2021
- December 2020
- November 2020
- October 2020
- September 2020
- August 2020
- July 2020
- June 2020
- May 2020
- April 2020
- March 2020
- February 2020
- January 2020
- December 2019
- November 2019
- October 2019
- September 2019
- August 2019
- July 2019
- June 2019
- May 2019
- April 2019
- March 2019
- February 2019
- January 2019
- December 2018
- November 2018
- October 2018
- September 2018
- August 2018
- July 2018
- June 2018
- May 2018
- April 2018
- March 2018
- February 2018
- January 2018
- December 2017
- November 2017
- October 2017
- September 2017
- August 2017
- July 2017
- June 2017
- May 2017
- April 2017
- March 2017
- February 2017
- January 2017
- December 2016
- November 2016
- October 2016
- September 2016
- August 2016
- July 2016
- June 2016
- May 2016
- April 2016
- March 2016
- February 2016
- January 2016
- December 2015
- November 2015
- October 2015
- September 2015
- August 2015
- July 2015
- June 2015
- May 2015
- April 2015
- March 2015
- February 2015
- January 2015
- December 2014
- November 2014
- October 2014
- September 2014
- August 2014
- July 2014
- June 2014
- May 2014
- April 2014
- March 2014
