8 Best Free Online Donut Chart Maker Websites
Here is a list of the best free online donut chart maker websites. Donut charts are used to show the proportions of categorical data, with the size of each piece representing the proportion of each category. It is also known as the Doughnut chart. A donut chart is a variation of pie chat. A pie chart shows the data points in a circle. A donut chart does the same with a hole in the center. So it uses the arcs to represent the data. Similar to the pie chart, it divides the hollow circle into arcs to represent the portions.
This post covers 8 websites where you can make donut charts online. It is a combination of absolutely free and partially free websites where you can make simple to stylish donut charts within minutes. Some websites offer more templates and design options to customize the appearance of the chart. Whereas some websites keep everything simple with minimal additional options. You can go through the post to check these out in detail.
My Favorite Online Donut Chart Maker
LivGap is my favorite donut chart maker website on this list. If you like to tweak the appearance of your chart then this is the website for you. It offers a bunch of customization options to change the color, font, label position, and many other options. One of the main highlights of this website is that it lets you animate the chart that you can download as a video file.
You can check out our other lists of the best free online Online Stock Chart Websites, Online Project timeline maker Websites, and Online MSE Calculator Websites.
LiveGap.com
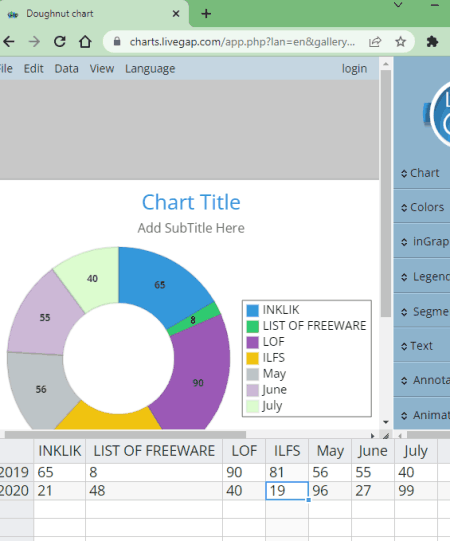
LiveGap is an online chart maker where you can make 11 different types of charts. It offers 50+ templates that you can customize to make your charts. You can make a donut chart with the “Doughnut Chart” chart option. When you select that option, it shows a random 2D donut chart on the screen. There you can add your data to the chart. There are two options to add the data. It has a spreadsheet for data, you can add your chart data directly to that. Or, you can import data from a CSV file. When you do that, it plots the chart along with the legend. To the right side of the chart, you get various options to customize the appearance of the chart. This includes changing colors, background, margin, position, padding, format, and font for both, chart and legend. You can also add title, subtitle, and other text to the chart. Last but not least, you can also animate the chart. There are two animations that it offers; Rotate and Scale. You can set the animation steps and easing option accordingly. With that, you can make a really good donut chart. Coming to export options, it lets you save the chart as an image or video. You have to go with the video option if the chart has animation. In that case, you also get to pick the speed of the animation. The chart you make here has a small text watermark at the bottom center. It is a simple text-based watermark that does not seem that intruding. But you can remove it with a paid plan that would also offer animated HTML export.
How to make a donut chart online on LiveGap?
- Go to the LiveGap website; a direct link is provided below.
- Click on the “Make Your Chart” button and select “Doughnut Chart” the available options.
- Add your chart data to the spreadsheet at the bottom section of the screen.
- Configure the customization options from the panel on the right side.
- Once done, click the “Save icon” below the chart.
- Pick “Image” or “Video” output when asked and save the chart.
Highlights:
- Templates: This website offers 50+ templates for 11 types of charts.
- Chart Type: It makes a flat 2D donut chart with a real-time preview.
- Input Options: Add/Paste spreadsheet data and CSV import.
- Chart Options: Customize colors, background, font, layout, and format.
- LegendOptions: Customize border, margin, position, space, and font.
- Text Options: Add Title, Sub Title, and more text.
- Additional Options: Options to add rotate and/or scale animation to the chart.
- Output: PNG, MP4 & CSV.
- Paid Features: Remove Watermark, Premium Charts & Fonts, Animated HTML Export, Freehand drawing, etc.
Moqups.com
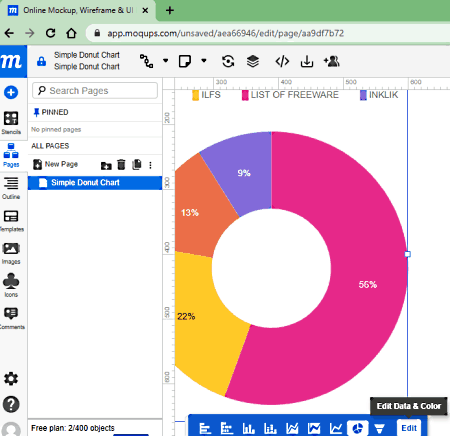
Moqups is an online wireframe and UI prototyping tool that you can use to make donut charts as well. To start with this tool, you have to sign up for a free account first. Then you can create a project and pick a donut chart template from the template collection. You can add your data to make the chart. The editor offers various customization options to change the color, shape, spacing, and layout of the chart. Apart from that, you can add shapes, images, and graphical elements to the chart. However, the free plan does not let you export the chart. Instead, you get a link that you can share with read-only and write permissions to share the chart.
How to make a donut chart online on Moqups?
- Go to the Moqups website and sign up for a free account.
- It takes you to a screen to “Create a New Project“. Use the search feature to find a donut chart template.
- Pick the template of your choice and then enter a name to create the project.
- Click on the chart and then click the “Edit” button that appears at the bottom of the chart.
- This opens a data table where you can edit chart data and add new columns/rows.
- After that, click-open the Format section from the top right corner of the screen.
- Use the available options to customize the appearance of your donut chart.
- In the end, click the Sharing option from the top middle. Set your sharing preference to get a link to share the chart.
Highlights:
- Templates: This website offers dozens of templates for various types of charts.
- Chart Type: It makes a flat 2D donut chart with a real-time preview.
- Input Options: Add data to a table or paste CSV data.
- Chart Options: Customizable color theme presets, change the font, donut shape tweaks, and set layout.
- LegendOptions: Same as Chart Options.
- Text Options: Add text blocks to make titles, subtitles, etc.
- Additional Options: Options to add images, icons, charts, and feedback comments.
- Output: No export in the free plan, only a sharing link.
- Paid Features: Premium Library, Real-time Collaboration, Export options, Feedback, and more.
TextMagic.com
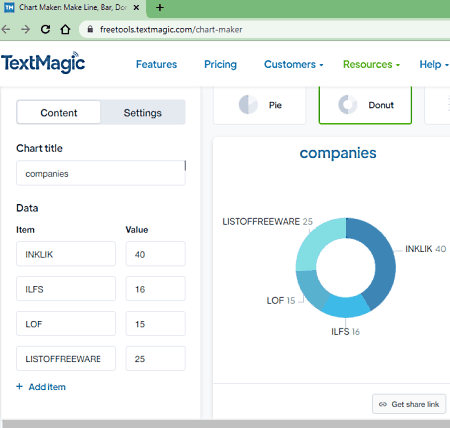
TextMagic has a free online Chart Maker tool where you can make Donut, Pie, Bar, and Line charts. It has a simple flat 2D chart design for all these chart types. The tool has a simple Content section where you can add your data to make the donut chart. Similarly, it has a Setting section where you can tweak the appearance by changing color themes and font face. There are no options for layout or format. But you get a toggle to show or hide the legend in the chart. If you add the legend, it follows the same color theme as the chart. But it makes it up for all the shortcomings with download options. After making the chart, you get options to export it as PNG, PDF, and CSV. On top of that, you can also grab a share link to the chart and use that to share the chart online.
How to make a donut chart online on TextMagic?
- Go to the Chart Maker on TextMagic using the link given below.
- Select the Donut chart from the chart type.
- Add the chart title on the left and add your chart data from the Content section.
- Toggle from Content to Settings to change the color theme, font, label, and legend options.
- Once done, use the Download button to export the chart or get a share link.
Highlights:
- Templates: This website offers a single template for Donut, Pie, Line, and Bar charts.
- Chart Type: It makes a flat 2D donut chart with a real-time preview.
- Input Options: Add data to a table or paste CSV data.
- Chart Options: Predefined Color Themes, Font, Show/hide Labels.
- LegendOptions: Option to show or hide the legend present alongside the chart.
- Text Options: Chart title only.
- Additional Options: No addtional features.
- Output: PNG, PDF, CSV & Share Link.
ImgFlip.com
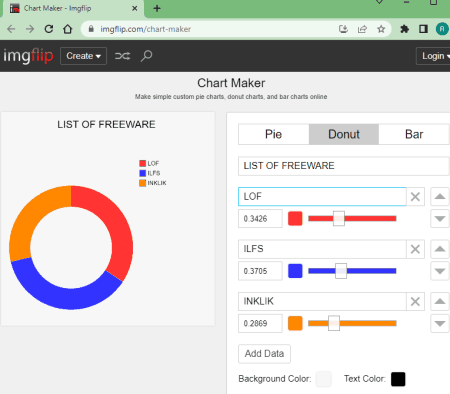
ImgFlip is another free website with an online chart maker tool. This can make Donut, Pie, and Bar charts. The process is quite simple for anyone to follow. There is no data spreadsheet or anything. Instead, you can simply add the slices to the chart one by one. Then you can add the portion of each slice or use the given slider to set the portion. Along with the slider, you get an option to choose a color for the slice. Similarly, you can also change the background color and text color. That’s all you can do here. In the end, it gives you a PNG image of the chart along with a share link. The image has a tiny watermark at the lower left corner.
How to make a donut chart online on ImgFlip?
- Go to the Chart Maker on the ImgFlip website using the link given below.
- Select the Donut chart from the chart type.
- Add the chart title and then add chart slices with data. Or use sliders to set the slice percentage.
- Pick the colors of choice for different slices along with background and text color.
- In the end, click the Make Chart button to get the chart image.
Highlights:
- Templates: This website offers a single template for Donut, Pie, and Bar charts.
- Chart Type: It makes a flat 2D donut chart with a real-time preview.
- Input Options: Add data for each value.
- Chart Options: Option to pick a color for each data value, text, and background.
- LegendOptions: No addtional options for legend.
- Text Options: Chart title only.
- Additional Options: No additional features.
- Output: PNG & Share Link.
- Paid Features: Remove Watermark.
ImageOnline.co
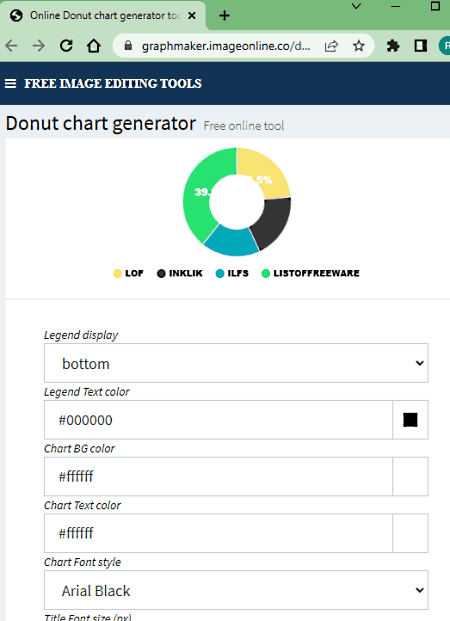
ImageOnline has a graph maker tool that covers various types of tools including an online donut chart maker. This is a simple tool that makes really elegant charts. You can simply add slices along with their values to make the chart. It also lets you pick different colors for different chart slices. You can make a 2D or 3D chart and select what value is to be displayed on the chart. It adds the legend on the bottom side of the chart. But you can change the position of the legend along with the text color. Similarly, you can also pick a background color, text color, font face, and font size. This tool generates a PNG image of the chart that you can download directly with any watermark or account.
How to make a donut chart online on ImageOnline?
- Use the link given below to open Graph Maker on the ImageOnline website.
- Select the Donut Chart maker from the side panel.
- Configure the legend position, legend text color, background color, text color, font face, and font size for the chart.
- Select the chart type (2D or 3D) and pick the data you want to show on the chart.
- Then add the desired number of slices to the chart along with the data. Pick different a different color to represent each slice in the chart.
- In the end, click the Download button to save the chart as a PNG image.
Highlights:
- Templates: This website offers a single template for the Donut chart.
- Chart Type: IT can make flat 2D and 3D donut charts with a real-time preview.
- Input Options: Add slice by slice with data.
- Chart Options: Option to pick a color for each data value, text, and background.
- LegendOptions: Option to choose legend position and text color.
- Text Options: None.
- Additional Options: No additional features.
- Output: PNG.
CodeBeautify.org
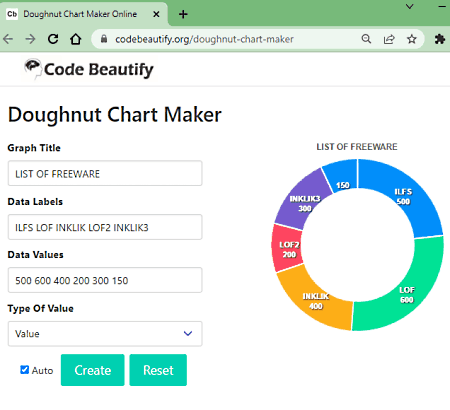
CodeBeautify is a popular website that offers formatting and beautifying tools for programming codes. It has a free online Doughnut Chart Maker. This is one of the quickest tools to make a donut chart online. However, it only has one template that does not include the legend with the chart. To make the chart, there is no need to add slices or use a table. You can simply add all your data values together separated by spaces. The same goes for the data labels. This way, you can make the chart and export it to PNG, SVG, or CSV.
How to make a donut chart online on CodeBeautify?
- Follow the link given below to open this Doughnut Chart Maker.
- Enter the chart title.
- Then add the data labels separated by spaces.
- Similarly, add data values separated by spaces.
- Pick the Type of Value from Percentage or Value.
Highlights:
- Templates: This website offers a single template for the Donut chart.
- Chart Type: IT can make flat 2D donut charts with a real-time preview.
- Input Options: Add data values separated by a space.
- Chart Options: No customization options.
- LegendOptions: No legend.
- Text Options: Chart title only.
- Additional Options: No additional features.
- Output: PNG, SVG & CSV.
Donutsvg.luckyfox.design
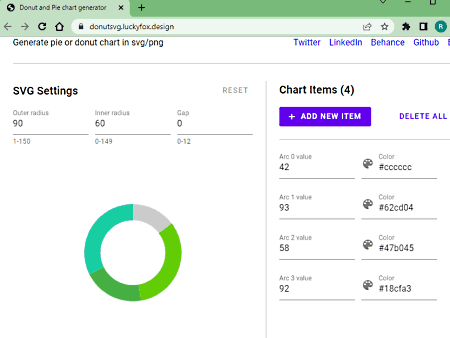
This is another simple website to make donut chart online. It features a simple chart maker tool. It shows the real-time chart preview on the right and the data value on the right. You can add your data values on the right side and pick a color for each value alongside. As you add the values, you can see the corresponding changes in the chart. There is no legend or label on the chart. But you do get to set the inner and outer radii and the gap for the donut shape. In the end, you can copy the SVG code of the chart to your clipboard. Or, you can export the chart as a PNG or SVG file.
How to make a donut chart online on this website?
- Go to the link given below to open this donut chart maker tool.
- On the right side of the screen, add new items (slices) with value and color.
- Then set the donut radii and gap from the top of the chart.
- Once done, use the “Save as” button to export the chart.
Highlights:
- Templates: This website offers a single template for the Donut chart.
- Chart Type: IT can make flat 2D donut charts with a real-time preview.
- Input Options: Add slice by slice with data.
- Chart Options: Option to pick a color for each data value. And radii and gap of the donut shape.
- LegendOptions: No legend.
- Text Options: None.
- Additional Options: No additional features.
- Output: PNG & SVG.
GeographyFieldWork.com
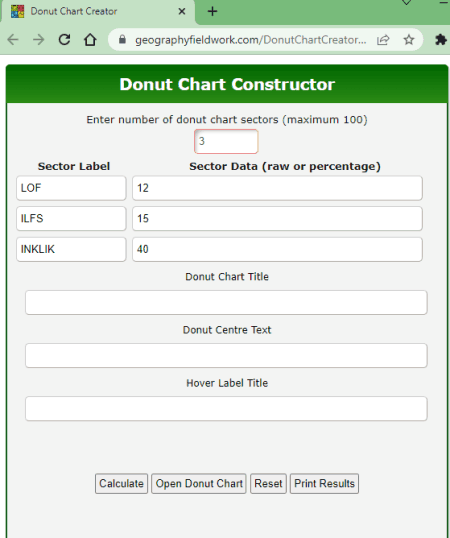
This is yet another website that offers an online donut chart maker. This tool starts by asking the number of chart sectors. When you add a number, it loads the same number of text fields for labels and data values. You can add the data values and labels. Along with that, you can also add a chart title and other texts. Then you can create a chart. First, it opens the chart in a new tab. You can check if everything is alright. Then from there, you can download the chart as a PNG image.
How to make a donut chart online on this website?
- Follow the link given below to open this donut chart maker tool.
- Enter the number of slices/data values that your chart contains.
- Then enter the label and data for each slice.
- Add the chart title and other text if needed.
- Then click the Calculate button to make the chart.
- Once done, click the Open Donut Chart button to view the chart.
- From that tab, click the camera icon to download the chart as PNG.
Highlights:
- Templates: This website offers a single template for the Donut chart.
- Chart Type: IT can make flat 2D donut charts with no preview.
- Input Options: Add slice by slice with data.
- Chart Options: No customization options.
- LegendOptions: No customization options.
- Text Options: Add a title, middle text, and hover text.
- Additional Options: No additional features.
- Output: PNG & SVG.


About Us

We are the team behind some of the most popular tech blogs, like: I LoveFree Software and Windows 8 Freeware.
More About UsArchives
- May 2024
- April 2024
- March 2024
- February 2024
- January 2024
- December 2023
- November 2023
- October 2023
- September 2023
- August 2023
- July 2023
- June 2023
- May 2023
- April 2023
- March 2023
- February 2023
- January 2023
- December 2022
- November 2022
- October 2022
- September 2022
- August 2022
- July 2022
- June 2022
- May 2022
- April 2022
- March 2022
- February 2022
- January 2022
- December 2021
- November 2021
- October 2021
- September 2021
- August 2021
- July 2021
- June 2021
- May 2021
- April 2021
- March 2021
- February 2021
- January 2021
- December 2020
- November 2020
- October 2020
- September 2020
- August 2020
- July 2020
- June 2020
- May 2020
- April 2020
- March 2020
- February 2020
- January 2020
- December 2019
- November 2019
- October 2019
- September 2019
- August 2019
- July 2019
- June 2019
- May 2019
- April 2019
- March 2019
- February 2019
- January 2019
- December 2018
- November 2018
- October 2018
- September 2018
- August 2018
- July 2018
- June 2018
- May 2018
- April 2018
- March 2018
- February 2018
- January 2018
- December 2017
- November 2017
- October 2017
- September 2017
- August 2017
- July 2017
- June 2017
- May 2017
- April 2017
- March 2017
- February 2017
- January 2017
- December 2016
- November 2016
- October 2016
- September 2016
- August 2016
- July 2016
- June 2016
- May 2016
- April 2016
- March 2016
- February 2016
- January 2016
- December 2015
- November 2015
- October 2015
- September 2015
- August 2015
- July 2015
- June 2015
- May 2015
- April 2015
- March 2015
- February 2015
- January 2015
- December 2014
- November 2014
- October 2014
- September 2014
- August 2014
- July 2014
- June 2014
- May 2014
- April 2014
- March 2014
