5 Best Free Online Dot Plot Maker Websites
Here is a list of best free online dot plot maker websites. Dot plot is a type of graph or chart which is used to visually highlight relatively small data sets. This chart is also known as dot chart or strip plot chart. To plot this chart, users need to provide multiple x and y axes values. According to the entered values, a graph consisting of dots will appear where each dot signifies a coordinate (xn, yn). If you also want to plot a dot plot chart with ease, then check out these websites.
These dot plot maker websites allow users to specify a range of values, axis names, and chart names to generate a custom dot plot chart. Through some websites, users can also create charts of other types like Bar, Line, Pie, Histogram, and more. The process to create a dot-plot chart is quite simple on these websites as users just need to enter the dot coordinate values to generate a chart. After generating a chart, users can save it is PNG, SVG, etc., formats. To help out new users, I have also included the necessary steps to make dot plot charts in the description of each website. Go through the list to know more about these websites.
My Favorite Online Dot Plot Maker Website:
GeoGebra is my favorite website as it can create and visualize dot charts and also calculate the mean, median, and standard deviation values.
You can also check out lists of best free Online PERT Chart, Online Stock Chart, and Online Infographic Maker websites.
GeoGebra
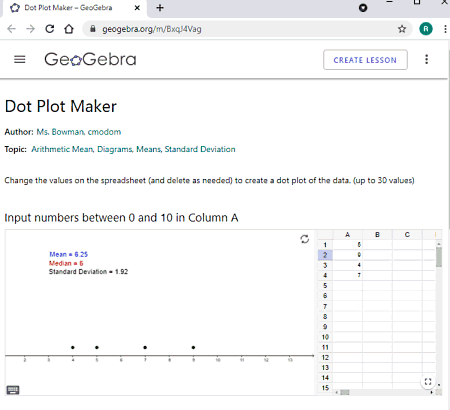
GeoGebra is a free online dot plot maker website. It is a simple dot plot maker website through which users can quickly plot a dot plot chart or graph. Now, to do that, it offers a spreadsheet in which users need to add values between 0 and 10. Plus, a maximum of 30 values can be inserted into the spreadsheet. According to the entered values, it generates and shows a dot plot graph. It also calculates and shows the Mean, Median, and Standard Deviation values. Now, follow the below steps to make a dot plot chart online using this website.
How to make dot plot chart online using GeoGebra:
- Visit this website and enter values between 0 and 10 in Column A. Similarly, users can add more values on columns B, C, D, etc.
- Users can also use its onboard keyboard to enter functions and symbols for advanced calculations.
- Next, click on the Enter button to view the dot plot chart along with mean, median, and standard deviation values.
Additional Features:
- This website also offers a good set of mathematical topics for students that they can learn such as Harmonic mean, sampling distribution, averages and outlier, and more.
Final Thoughts:
It is one of the best free online dot plot maker websites that can also be used to calculate the mean, median, and standard deviation values.
cqs.app.vumc.org
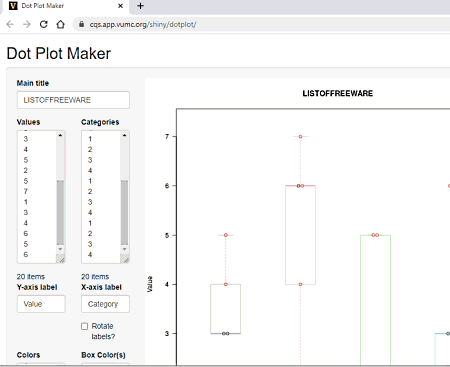
cqs.app.vumc.org is a free online dot plot maker website. Using this website, users can create custom dot plot charts by manually providing the X and Y axis values. In addition to that, it also allows users to highlight the different range of values in a unique color like gray, pink, light blue, etc. To plot a dot plot chart, it comes with three plot types namely Dots, Dots over box, and Box over dots. Before starting the dot plot-making process, users can also specify the Mean/ Media line and Jitter values. Now, follow the below steps to make dot plot chart using this website.
How to make dot plot chart online using geogebra.org:
- Start this app and specify the title of the dot plot chart in the Main Title field.
- After that, manually specify the X and Y axis values along with axis names.
- Now, choose the dot plot type from three available ones and specify the dot plot box colors if you want.
- Lastly, specify the Mean/Median Line and Jitter values and click on the Plot button to generate a desired dot plot chart.
Users can save the final dot plot chart in PNG image format.
Final Thoughts:
It is a good online dot plot maker website through which users can create all types of dot plot charts consisting of dots, boxes, and colors.
mathsisfun.com
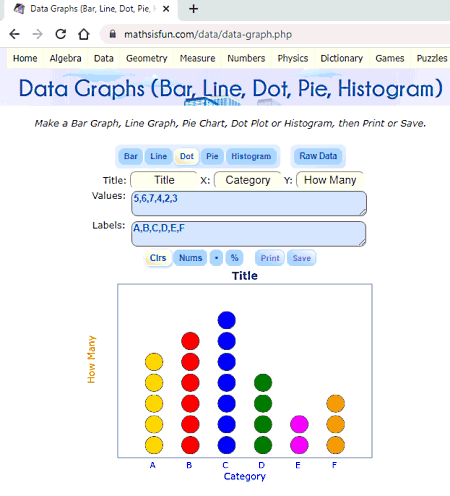
mathsisfun.com is another free online dot plot maker website. Using this website users can easily create dot plot charts by specifying multiple chart plot values. Along with chart plot values, users can also add labels with each value. Apart from dot plot charts, it can also be used to create Bar, Line, Pie, Histogram, and Raw Data graphs. Now, follow the below steps to make dot plot online using this website.
How to make dot plot chart online using mathsisfun.com:
- Go to this website and select the Dot plot option.
- After that, manually enter all the coordinates for the dot plot.
- Next, specify dot labels and click on the Save button to preview and save the final dot chart in PNG image format.
Additional Features:
- This website offers multiple online mathematics learning and practice tools such as Algebra, Data, Geometry, Numbers, and more.
Final Thoughts:
It is another good online dot plot maker online website through which users can create dot, pie, line, bar, etc., graphs.
desmos.com
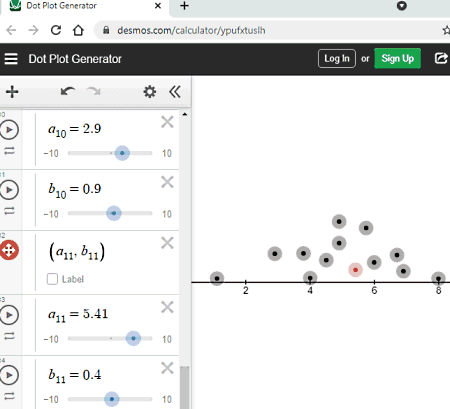
desmos.com is yet another free online dot plot maker website. It is an interactive dot plot maker online website that allows users to directly place dots over the graph to make a got plot graph. Besides this, it offers function sliders through which users can specify the position of dots over the graph like a1, b1, a2, b2, and more. Now, follow the below steps.
How to make dot plot chart online using desmos.com:
- Start this website and manually position the dots over the graph according to your requirements.
- Users can also use a1, b1, a2, b2, etc., sliders to precisely position the dots over the graph.
- After that, use the Zoom tools to closely analyze the graph.
- Lastly, go to Export and save the graph in PNG and SVG image formats.
Additional Feature:
- Graphs: This website can also be used to plot-line, parabola, trigonometry, Polas, Conic, etc., graphs.
Final Thoughts:
It is another simple-to-use online dot plot maker website that anyone can use to plot dot graphs.
statistika.mfub.bg.ac.rs
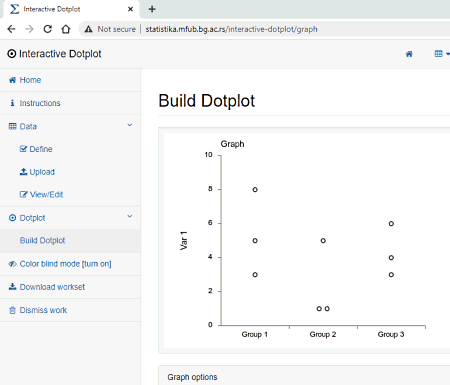
statistika.mfub.bg.ac.rs is the last free online dot plot maker website. Using this website, users can create a fully custom dot plot graph. To do that, users can manually specify the number of groups and the number of variables. According to the table variables, this website generates a table with empty fields. Now, enter the numerical values to the field to specify the coordinates of the dots in the dot plot graph. Now, check out the below steps.
How to make dot plot chart online sttistika.mfub.bg.ac.rs:
- Go to this website and go to the Data Define section to specify the table structure by providing the number of groups and values you want in the table.
- After that, go to the View/Edit section to view the table and make any changes to it.
- Next, enter the numerical values in the table fields to specify the dot coordinates.
- In the end, save the changes and go to the Dot plot section to view the generated dot plot.
Users can also save the final graph locally.
Final Thoughts:
It is another good online dot plot maker website through which users can create custom dot plots.


Naveen Kushwaha
Passionate about tech and science, always look for new tech solutions that can help me and others.
About Us

We are the team behind some of the most popular tech blogs, like: I LoveFree Software and Windows 8 Freeware.
More About UsArchives
- May 2024
- April 2024
- March 2024
- February 2024
- January 2024
- December 2023
- November 2023
- October 2023
- September 2023
- August 2023
- July 2023
- June 2023
- May 2023
- April 2023
- March 2023
- February 2023
- January 2023
- December 2022
- November 2022
- October 2022
- September 2022
- August 2022
- July 2022
- June 2022
- May 2022
- April 2022
- March 2022
- February 2022
- January 2022
- December 2021
- November 2021
- October 2021
- September 2021
- August 2021
- July 2021
- June 2021
- May 2021
- April 2021
- March 2021
- February 2021
- January 2021
- December 2020
- November 2020
- October 2020
- September 2020
- August 2020
- July 2020
- June 2020
- May 2020
- April 2020
- March 2020
- February 2020
- January 2020
- December 2019
- November 2019
- October 2019
- September 2019
- August 2019
- July 2019
- June 2019
- May 2019
- April 2019
- March 2019
- February 2019
- January 2019
- December 2018
- November 2018
- October 2018
- September 2018
- August 2018
- July 2018
- June 2018
- May 2018
- April 2018
- March 2018
- February 2018
- January 2018
- December 2017
- November 2017
- October 2017
- September 2017
- August 2017
- July 2017
- June 2017
- May 2017
- April 2017
- March 2017
- February 2017
- January 2017
- December 2016
- November 2016
- October 2016
- September 2016
- August 2016
- July 2016
- June 2016
- May 2016
- April 2016
- March 2016
- February 2016
- January 2016
- December 2015
- November 2015
- October 2015
- September 2015
- August 2015
- July 2015
- June 2015
- May 2015
- April 2015
- March 2015
- February 2015
- January 2015
- December 2014
- November 2014
- October 2014
- September 2014
- August 2014
- July 2014
- June 2014
- May 2014
- April 2014
- March 2014
