16 Best Free Online Infographic Maker
Infographics are graphical representation of content in a more interactive and attractive manner. An ideal infographic consists of good design, relevant data and information of the story it has, color scheme, typeface used, theme and credits if required. Infographics have icons, text, charts, symbols, images, etc., in them.
Infographics can be used at different places such as books, magazines, newspaper, on the web, as poster and many more. With the given list of online infographic makers you can create different infographics and charts easily out of the data or content you have.
You may also like Best Online Photo Editors, Best Vector Graphics Editors and Best Free Cloud Storage Services.
Here is the List Of 17 Best Free Online Infographic Maker:
Visme
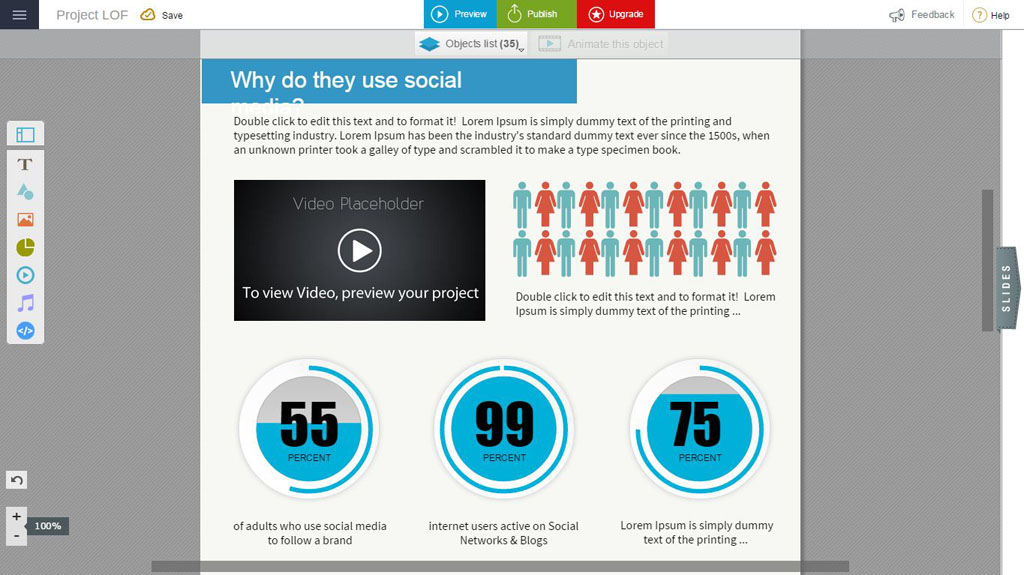
Visme is an interactive information graphic or infograhic maker available to you for free online. Visme Basic account allows you to create up to 3 projects and gives you 100 MB of free storage space. The infographics created using Visme can be published as well as downloaded as JPG format files. The privacy of projects created on Visme are set to public by default, thus they cannot be private. All the infographics created with Visme will have the logo or brand name of Visme on them. You can add text, image, shapes, charts and graphs, video, music and iframes in infographics of Visme.
Canva
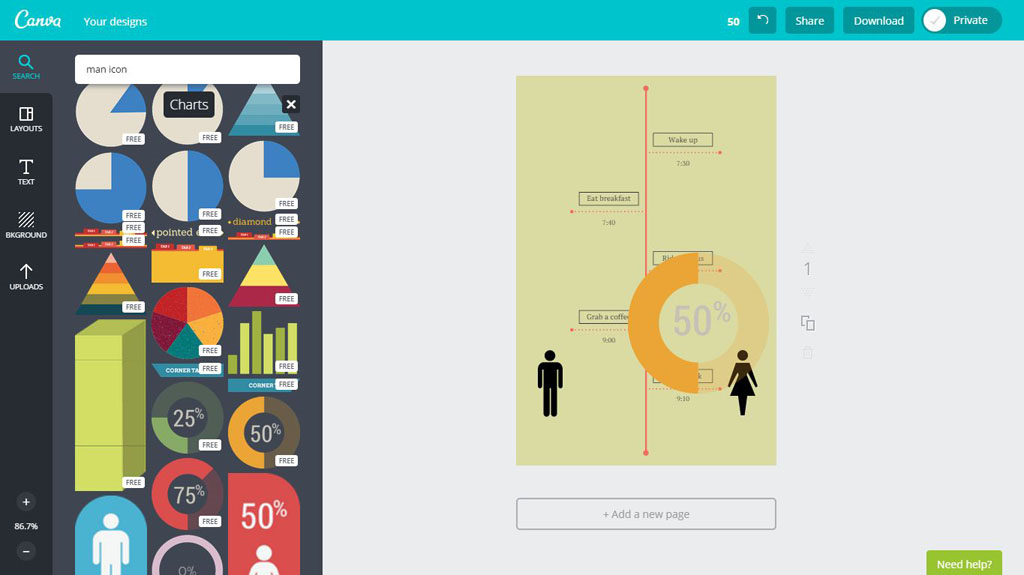
Canva is a powerful online infographic maker that has one of the best web-interface an online tool can have. Canva has many options to add graphics, text, layouts, designs, images and a lot more. In addition to creating infographics, Canva can help you make Social Media, Instagram Post, Twitter Post, Pinterest Graphic, Facebook Post, Facebook App, Facebook Cover, Google+ Photo, YouTube Channel Art, Twitter Header, Business Card, Poster, Real Estate Flyer, Food & Drink Menu and many more.
Vizualize
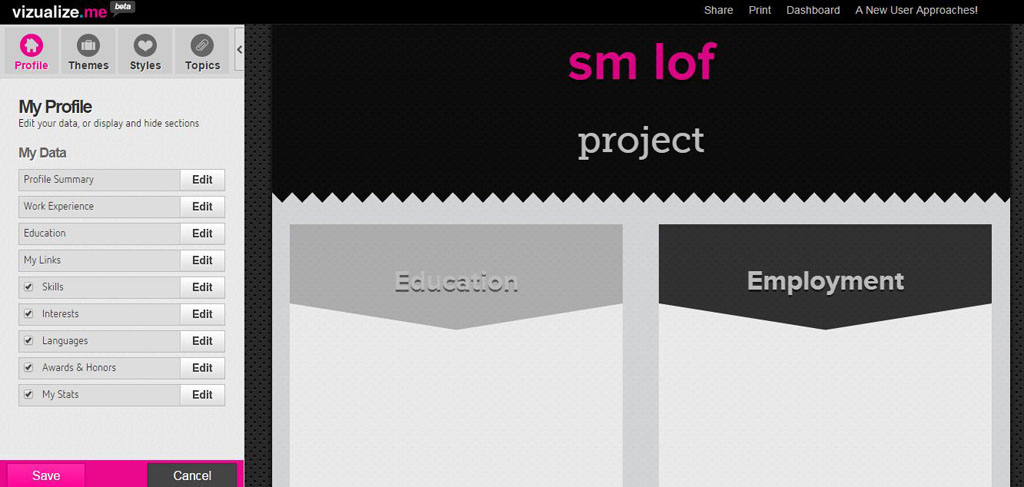
Vizualize is another good tool that is free and is available online as an infographic maker. This infographic maker is good and has the ability to modify the elements of the infographic such as color scheme used in it, the font of the content, etc. You can also upload your own background image if needed.
Google Charts
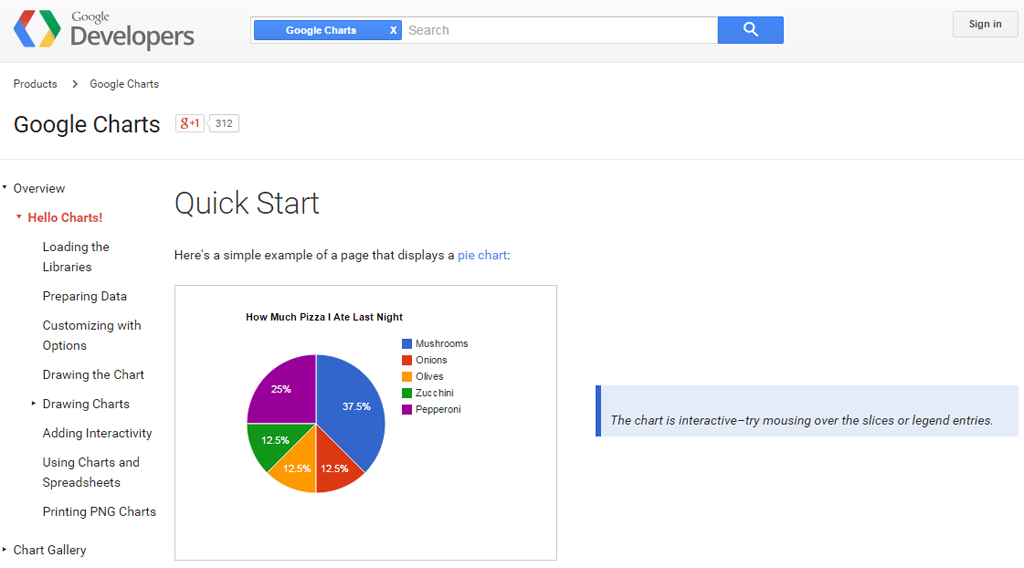
Google Charts provide interactive and real-time based infographics and charts. With Google Charts, you can create area charts, bar charts, combo charts, histograms, intervals, maps, timelines, table charts, sankey diagrams, table charts, word trees, etc. All the charts created with Google Charts are fully interactive and responsive. The charts can be customized, free and easy to make.
Easel.ly
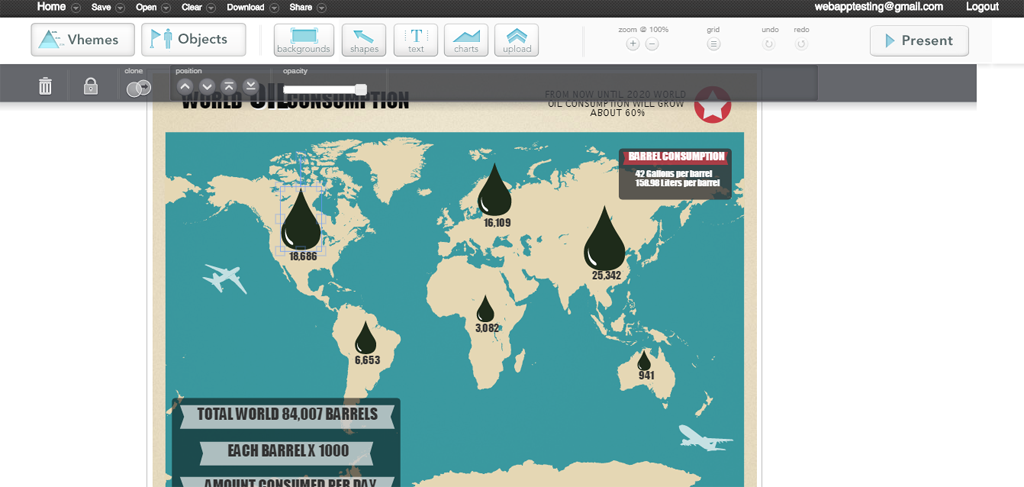
Easel.ly is an online application for creating different kinds of infographics, charts and infograms. This infographic maker application is easy to use and works beautifully with your data, images and information. There are hundreds of example infographics in Easel.ly that you can choose as template and start working on them with your own data and information. There are various tools that can help you with creating inforgraphics online like themes, objects, backgrounds, shapes, text, charts, upload, zoom, grid, undo, redo and present. The size, color and opacity of each element on the custom infographic can be changed according to your wants.
Piktochart
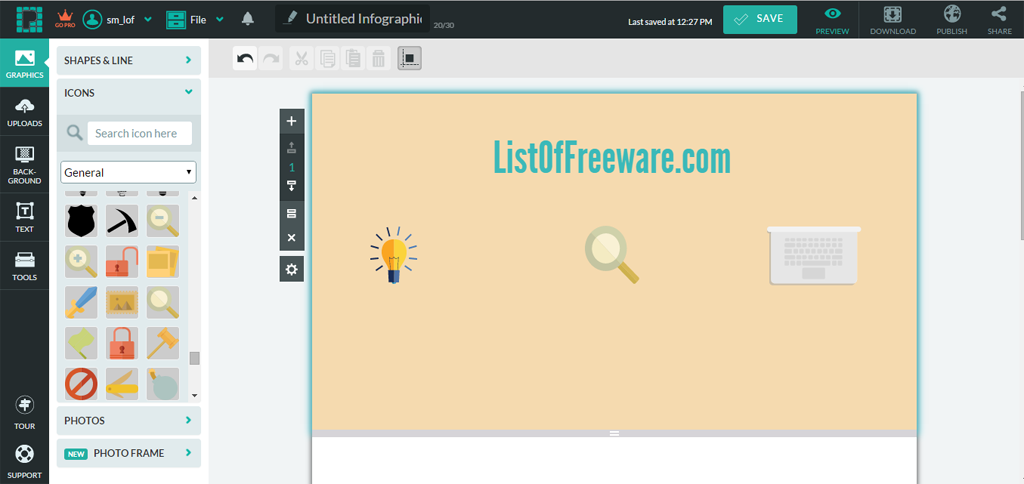
Piktochart is free infographic designing app that helps in making different kinds of infographics like standard infographics, report infographics, banner infographics and presentation infographics. This online infograhic maker has interactive maps, elegant fonts, categorized collection of icons and shapes, photos of different genres, background options and much more. In addition to infographics, Piktochart also lets you create report, banner and presentations. You can download, publish and share the created infographic.
Infogr.am
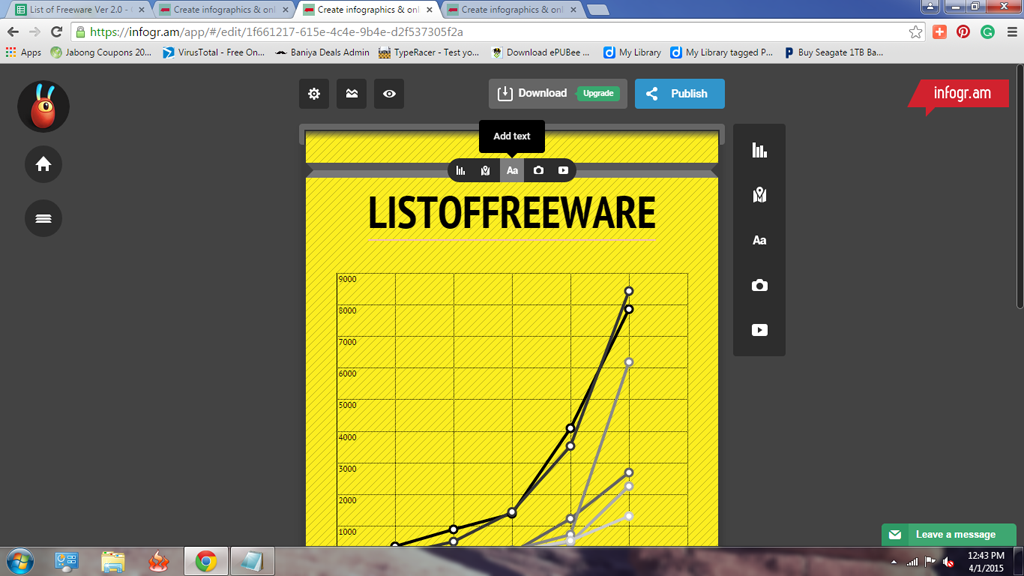
Infogr.am is one of the most popular infographic, charts and maps maker that is available to people on the web. This online infographic maker is capable of creating interactive and responsive infographics. You can add image, map, video, text and chart wherever you want on the infographic. You cannot download the created infographic but can publish it online and share it. If you want the infographic to be downloadable then you will have to upgrade to pro plan.
Venngage
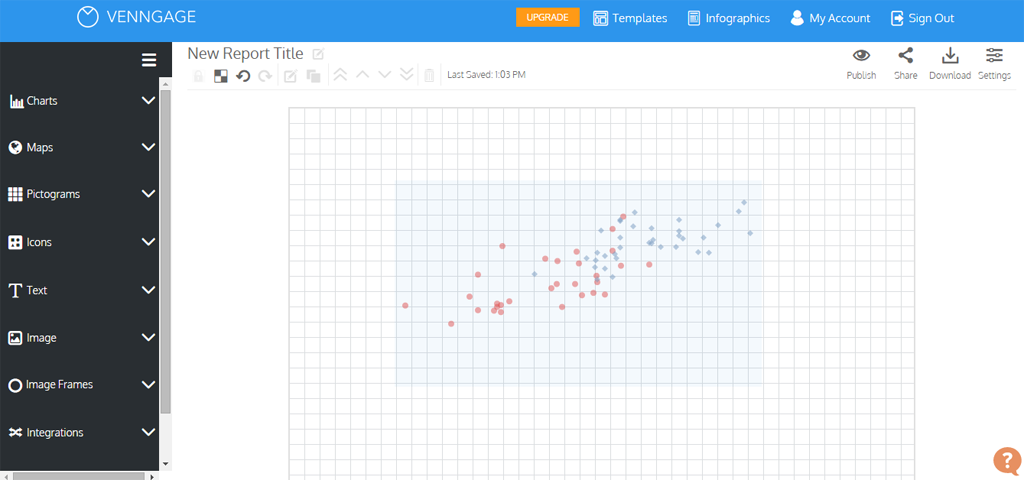
Venngage lets you freely create infographics online without having much knowledge about designing. It is easy to use online application for making infographics. There are various templates and themes available to be chosen that can help you start working on, otherwise you can start a blank infographic as well. As it is a free version you have limited access only to free icons, themes, templates, charts and number of infographics. All the infographics created with the free version of Venngage, have the brand logo of Venngage on them.
Onlinecharttool
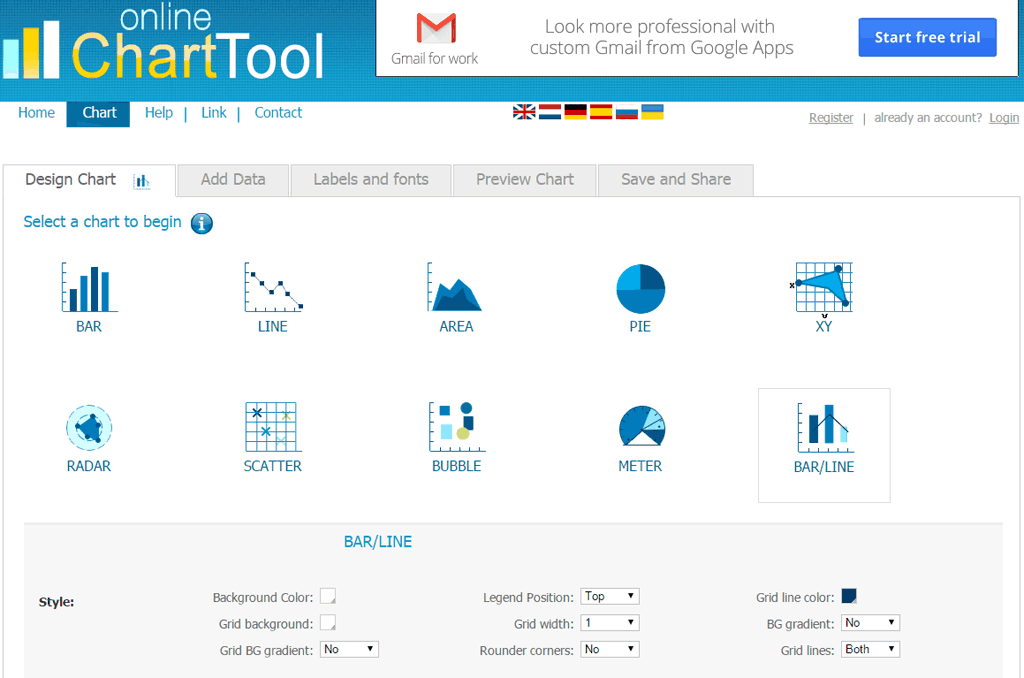
Onlinecharttool is an online tool for creating charts in an easy and systematic way. On the startup of creating the chart you will be asked to select the chart type to begin working with. Depending on the chart option you choose, the settings will change in the next menu options. You can stylize the chart by choosing the colors, width and other relevant details. The charts created with this application can also be saved and shared after completing the creation procedure. Onlinecharttool web application is available in different languages as well.
Many Eyes
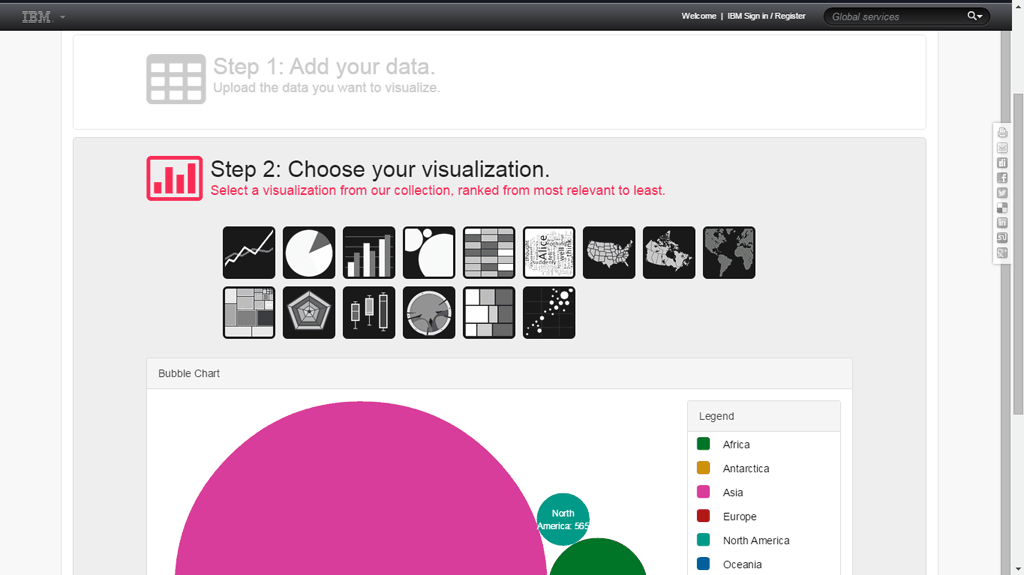
Many Eyes has been developed by IBM for making infographics easy for you. This online application works after registering on the website. To create an inforgraphic or visualization using Many Eyes, click on the Create tab and follow the step by step process mentioned including steps like add your data, choose your visualization and share your creation. The infographic maker, Many Eyes is simple and interactive method of creating infographics easily. Before you can share the infographic, you will have to provide the details and information about it. After you are done you can click on finalize and share button.
Hohli
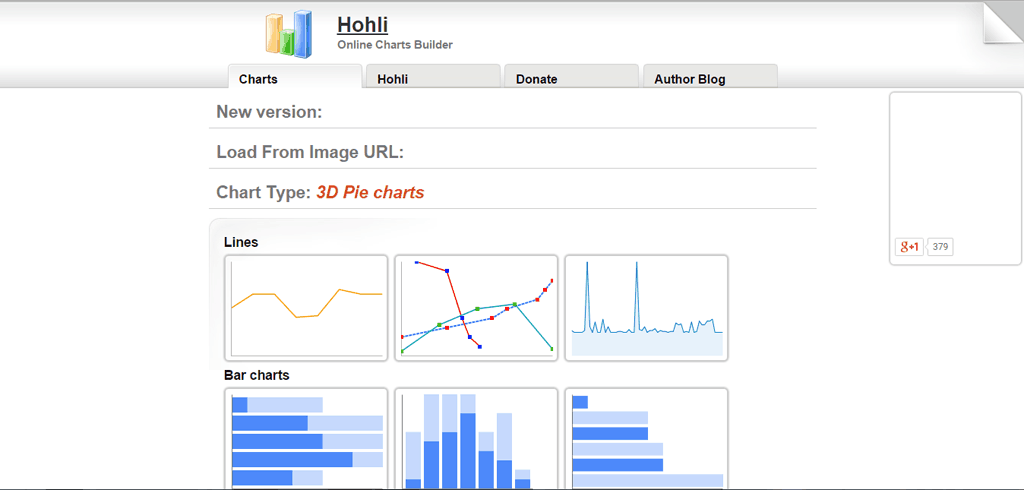
Hohli is an interactive online infographic maker that helps in making charts of different types by entering the data and choosing the output style of the infographic. The input methods and settings change according to the chart type you select. The different types of charts available in Hohli include pie charts, lines, bar charts, radar charts, venn diagrams and scatter plots. Colors for the details in the chart can be changed by using the background settings. You can also choose the chart size depending on your requirements. Hohli does not require any kind of registration for creating the infographic.
Snappa.com
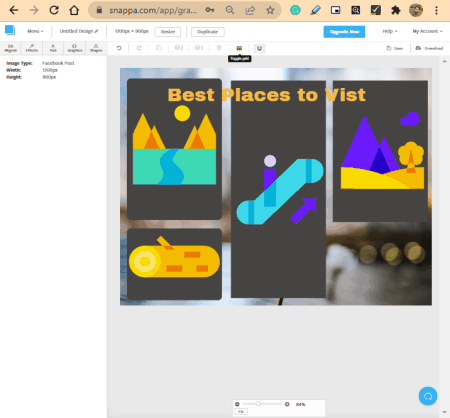
Snappa.com is a free infographic maker which generates word cloud based on the content or data pasted in the text adding area. Alternatively you can also generate word cloud infographic with the help of the link or URL of the blog, blog feed or a web page you want the word cloud to be of. In Wordle you can define language settings, font type, layout of the words and change the color of the words and the background. It is easy to save the final word cloud as a PNG file on your computer or you can also print it.
ChartsBin
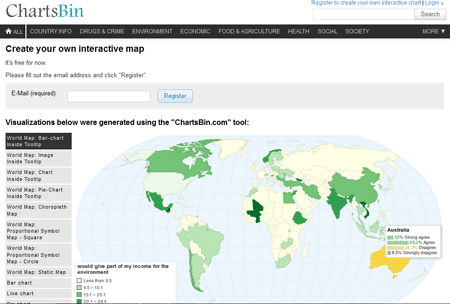
To create infographics using the online infographic tool ChartsBin, you will have to register for an account. The web application is free to use and has really interactive chart options. It can create infographics with the help of CSV file types as it can detect the added content of it easily. All the visualizations created by you will be shown in the tab My Visualizations.
Datawrapper
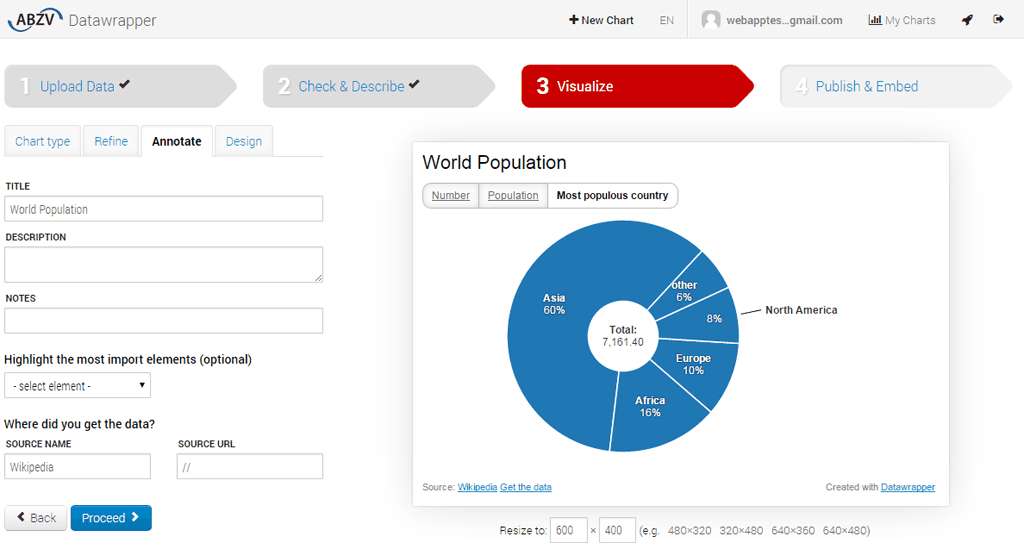
Datawrapper is another good online infographic maker that is available for free for the users. You can upload your data in form of a text or csv file and generate infographic chart by following the easy process of defining the style of chart, you can choose bar chart, line chart, data table, map, election donut, donut chart, stacked column chart, column chart, donut chart, grouped chart, etc. You can also mention the size of the chart by mentioning the dimensions at the bottom of the designed chart. With the help of Datawrapper, you can save the chart by exporting it as a static image, printing the chart, download chart as an archive and duplicate chart. To embed your chart somewhere you will have to upgrade the account.
Spritesapp
In the free account of Spritesapp, you will have access to all the basic features and tools of this infographic maker. You can sign up for the free account of spritesapp with your email address. On the startup of the web application’s dashboard, you will be asked to give a title for the new infographic and choose a theme for it too. You can add icons, text, map, charts, quotes, facts, image, line, etc., in the infographic.
Diychart

Create different charts with Diychart by adding the data or content from CSV file or add the details manually in the Source Data section. The layout settings of the chart can be changed from the Parameter section where you can change how the chart appears, chart title, plot area, legend and other relevant properties. You can save the generated chart as BMP, JPEG, PNG and EMF. An image html link is also generated after you have created the infographic.


About Us

We are the team behind some of the most popular tech blogs, like: I LoveFree Software and Windows 8 Freeware.
More About UsArchives
- May 2024
- April 2024
- March 2024
- February 2024
- January 2024
- December 2023
- November 2023
- October 2023
- September 2023
- August 2023
- July 2023
- June 2023
- May 2023
- April 2023
- March 2023
- February 2023
- January 2023
- December 2022
- November 2022
- October 2022
- September 2022
- August 2022
- July 2022
- June 2022
- May 2022
- April 2022
- March 2022
- February 2022
- January 2022
- December 2021
- November 2021
- October 2021
- September 2021
- August 2021
- July 2021
- June 2021
- May 2021
- April 2021
- March 2021
- February 2021
- January 2021
- December 2020
- November 2020
- October 2020
- September 2020
- August 2020
- July 2020
- June 2020
- May 2020
- April 2020
- March 2020
- February 2020
- January 2020
- December 2019
- November 2019
- October 2019
- September 2019
- August 2019
- July 2019
- June 2019
- May 2019
- April 2019
- March 2019
- February 2019
- January 2019
- December 2018
- November 2018
- October 2018
- September 2018
- August 2018
- July 2018
- June 2018
- May 2018
- April 2018
- March 2018
- February 2018
- January 2018
- December 2017
- November 2017
- October 2017
- September 2017
- August 2017
- July 2017
- June 2017
- May 2017
- April 2017
- March 2017
- February 2017
- January 2017
- December 2016
- November 2016
- October 2016
- September 2016
- August 2016
- July 2016
- June 2016
- May 2016
- April 2016
- March 2016
- February 2016
- January 2016
- December 2015
- November 2015
- October 2015
- September 2015
- August 2015
- July 2015
- June 2015
- May 2015
- April 2015
- March 2015
- February 2015
- January 2015
- December 2014
- November 2014
- October 2014
- September 2014
- August 2014
- July 2014
- June 2014
- May 2014
- April 2014
- March 2014
