10 Best Free Online Inequality Graph Maker Websites
Check out these best free Online Inequality Graph Maker websites. In mathematics, inequality is a relation between two expressions or values that are not equal. Inequality equations use the ‘greater than’ or ‘less than’ operators. You can solve such equations for inequality to get the inequality relation. With that relation, you can make a graph.
This post covers 10 free websites where you can plot inequality equations or expressions. Each website offers a simple tool where you can either add the equation or expression to make the graph. Some websites can also plot multiple equations on a graph and help you determine the various regions. Apart from plotting, you get options to customize the appearance of the graph. Different websites offer different customization options including color schemes, axis range, labels, etc. And at the end, you can save or share the graph. With that said, let’s go through the post to check these out in detail.
My Favorite Online Inequality Graph Maker
QuickMath.com is my favorite website on this list to make inequality graphs online. This website can plot multiple equations and lets you assign a different color to each equation. This makes it easy to distinguish equations o the graph. Along with that, you get various options to customize the graph and display different regions of the graph.
You can check out our other lists of the best free online Inequality Calculator websites, online Nernst Equation Calculator websites, and online Diagonalize Matrix Calculator websites.
Overview Table:
| Websites | Input Type | Graph Customizations | Save Graph |
|---|---|---|---|
| QuickMath.com | Direct | Data Points, Regions | Indirect* |
| WolframAlpha.com | Direct | Colors, Data Points | Multiple Options |
| WebMath.com | Guided | - | Indirect* |
| MathsisFun.com | Direct | - | Multiple Options |
| GeoGebra.org | Direct | Colors, Data Points, Text | - |
| Desmos.com | Direct | Colors, Data Points | Multiple Options |
| Transum.org | Direct | Colors, Data Points | - |
| CoolGyan.org | Guided | - | Indirect* |
| Byjus.com | Direct | - | Indirect* |
| MathPapa.com | Direct | Data Range | - |
| * Save as image from right-click context menu |
QuickMath.com
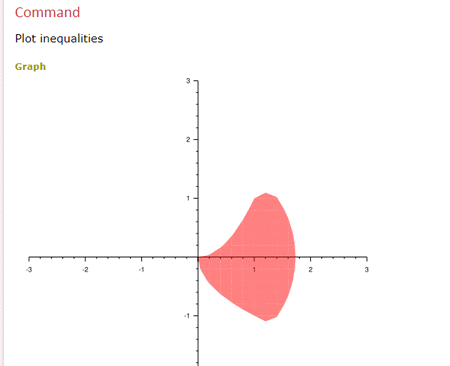
QuickMath.com is a free website where you can find a vast collection of math calculators and tools. It has an Inequalities tool where you can solve and plot equations for inequalities. Both these functions are separated into different sections. You can plot a graph from the Graph section. It has six input fields where you can add your equations. You can use it for one equation or add multiple equations. Alongside the equation input, you get a dropdown for colors. You can assign a color to an equation to represent that equation in the graph. This makes it easily distinguishable in the case of multiple equations. Apart from the equation, you get to customize what to show on the graph. You can set the variable names and ranges for the axis. You can show/hide the axis, add grid lines and set the line width. You can also add the title and legend. In the case of multiple equations, you can also mark regions. You can go for intersection, union, or show all the regions. You can configure the options as per your liking and plot the graph. Despite having all these options, this tool does not have a direct option to save or print the chart. But if you want to save the chart, you can save it as an image from the right-click context menu.
How to make an inequality graph online with QuickMath?
- Go to the Inequalities graph maker on QuickMath using the link given below.
- Add your equation and pick a color for it from the dropdown menu. You can add multiple equations and set different colors for each one.
- Customize the graph options and variable range if you want.
- Then click the Plot button to get the graph.
Highlights:
- Input Type: Directly add equations and pick colors.
- Graph Customization(s): Colors, Grids, Axis, Line, Title, Legend, Variables, and Region type.
- Save Graph: Save as PNG from right-click context menu.
WolframAlpha.com
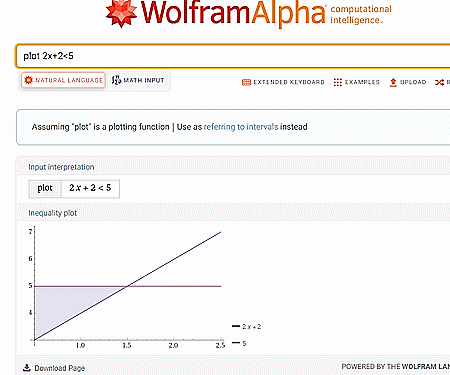
WolframAlpha.com is an answer engine where you can get your queries solved. It supports various topics covering Mathematics, Physics, Chemistry, etc. You can simply enter an equation into it with the prefix “plot” to make the equation graph. It also features an on-screen math keypad that you can use to type equations with proper math parameters. When you do that, it plots the graph of that equation. Alongside the graph, you get customization options where you can change the color scheme, add data, a title, and a frame around the graph. In the end, you can save the graph from the right-click context menu. And if you go with the paid plan, you get more download options in various file formats and resolutions.
How to make an inequality graph online with WolframAlpha?
- Go to the WolframAlpha website.
- On the homepage, type “Plot” followed by the equation. You can also use the on-screen keypad to enter your equation.
- Then press the enter key to plot the graph.
Highlights:
- Input Type: Directly add an equation.
- Graph Customization(s): Color scheme, data, title, and frame.
- Save Graph: Save as PNG from right-click context menu, paid members can customize and save the graph.
WebMath.com
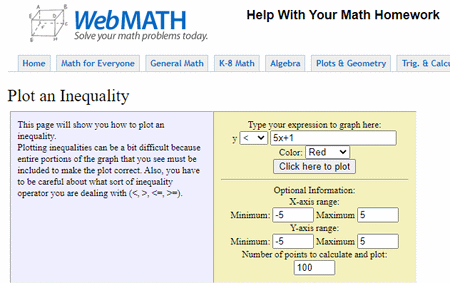
WebMath.com is a free website where you can solve math problems online. It offers a tool to plot an inequality. This tool has a simple layout where you can insert the expression that you want to graph. While doing so, you can also pick a color for it. Along with that, it also lets you add optional information to the graph. You can set the axis range for the x-axis and y-axis. You can also set the number of points that you want to calculate and plot on the graph. With that, this tool generates a graph. It shows the slope of the expression with the specified number of points. There is no direct option to save the graph. But you can download it as a GIF file using the “Save image as…” option from the right-click context menu.
How to make an inequality graph online with WebMath?
- Follow the link given below to open this tool in your browser.
- Enter your inequality equation into the tool and pick a color for its graph.
- Set the optional axis range along with the number of points.
- Then use the “Click here to plot” button to make the graph.
Highlights:
- Input Type: Guided with an option to pick graph color.
- Graph Customization(s): Set axis range and number of points to plot.
- Save Graph: Save as GIF from right-click context menu.
MathsisFun.com
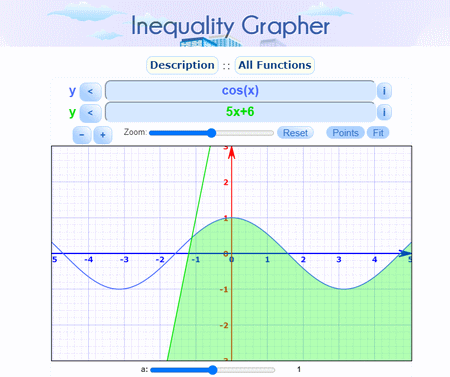
MathsisFun.com is another free website where you can solve and plot math problems. It has an Inequality Grapher tool that can plot one or more inequality expressions on a single graph. You can simply add the expression and get the graph instantly. Also, you can opt-in to show the points on the graph. It lets you move the graph around and set the zoom level for it. Below the graph, you get options to share and save the graph. There is a “Link” option that gives you a shareable link. Then there are options to print and save the graph as well.
How to make an inequality graph online with MathsisFun?
- Open this Inequality Grapher in your browser using the link given below.
- Add your expression to the tool and choose the correct inequality parameter. You can add multiple expressions to plot together.
- As you add the expression(s), it instantly plots a graph.
Highlights:
- Input Type: Guided with an option to pick graph color.
- Graph Customization(s): Plot points in the graph.
- Save Graph: Print, Link, and Save as PNG.
GeoGebra.org
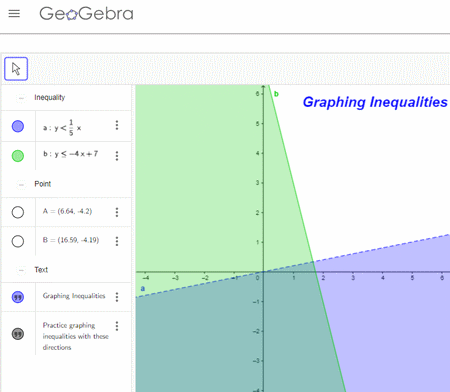
GeoGebra.org offers a free online inequality graph maker. This tool has a small section on the left side of the screen. The section is divided into three segments. The first segment is for inequality equations. You can directly add or paste one or multiple equations there. While doing so, you can also assign a color to each equation. As you add the equation(s), it instantly plots that on the graph. The second segment lists the points that you can also show on the graph. And the third section is where you can add text to show on the graph. That’s all that this tool offer. There is no way to save or print the graph here.
How to make an inequality graph online with GeoGebra?
- Use the link given below to open this tool.
- Add the inequality equations directly on the left side of the tool. You can also set the color.
- Doing this gets you the graph instantly.
Highlights:
- Input Type: Directly add equations.
- Graph Customization(s): Set region colors, show points, and add text.
- Save Graph: N/A.
Desmos.com
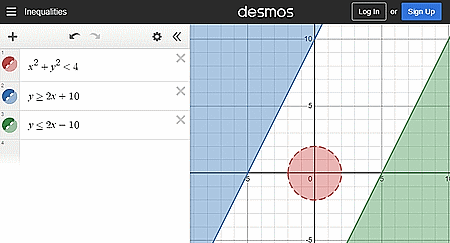
Desmos.com is an online graph maker website. It has a big graph area on the screen with an input section on the right and a math keypad at the bottom. You can hide both of these sections to have the graph on the entire screen. The website has a list of examples that you can use for reference. Otherwise, you can simply add the expression to make the graph. You can add as many expressions as you want and configure a color scheme for all. The graph is draggable allowing you to view each and every section. Also, you can configure what you want to show on the graph. This includes axis range, axis label, grid, viewpoint, contrast, etc. And once the graph is plotted, you can get a sharable link to it, export it as an image, print it, or get embed code.
How to make an inequality graph online with Desmos?
- Use the link given below to open this tool.
- Add the inequality equations directly on the left side of the tool. You can also set the color.
- Doing this gets you the graph instantly.
Highlights:
- Input Type: Directly add equations.
- Graph Customization(s): Set region colors, grid, and axis range and label.
- Save Graph: Link, Print, Image, and Embed code.
Transum.org
Transum.org is another website where you can make an inequality graph online. This website uses the Desmos tool. Thus it has identical features and process to graph inequality equations. You can simply add one or more equations and graph them all with a desired color scheme. Similarly, you can set the graph parameters such as axis range, axis label, etc. The only difference is that it does not have the “Share” button that you get on Desmos. That means you can not save or share the graph.
How to make an inequality graph online with Transum?
- Follow the link given below to open this tool.
- Add the inequality equations directly on the left side of the tool. You can also set the color.
- Doing this gets you the graph instantly.
Highlights:
- Input Type: Directly add equations.
- Graph Customization(s): Set region colors, grid, and axis range and label.
- Save Graph: N/A.
CoolGyan.org
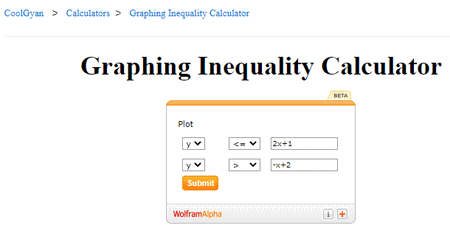
CoolGyan.org is a free website where you can make an inequality graph online. This website embedded the Wolfram Alpha plotter tool. The tool takes the inequality expression as input. When you run the tool, it opens a new tab and plots the graph there. It does not offer any other options that you get on Wolfram Alpha itself. It simply plots the graph that you can save as an image from the right-click context menu.
How to make an inequality graph online with CoolGyan?
- Follow the link given below and scroll down to get to the Graphing Inequality Calculator.
- Add the inequality expressions into the tool there.
- Then click the Submit button to plot the graph.
Highlights:
- Input Type: Guided input to add inequality expression.
- Graph Customization(s): N/A.
- Save Graph: Save as PNG from right-click context menu.
Byjus.com
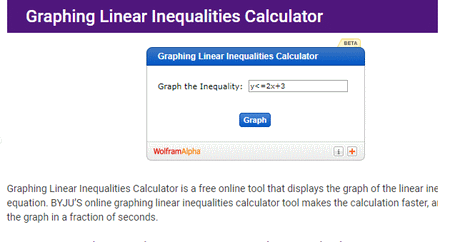
Byjus.com is an online learning platform that has a Graphing Linear Inequalities Calculator. The calculator is actually a Wolfram Alpha widget to graph the inequality. You can simply add the inequality equation into the tool and plot. The tool opens a new tab where it shows the interpretation of the input and plots a graph accordingly. There is no option to configure or customize the graph. But you can save it as an image from the right-click context menu.
How to make an inequality graph online with Byjus?
- Use the link given below to get to the Graphing Linear Inequalities Calculator.
- Add the inequality expressions into the tool there.
- Then click the Graph button to plot the graph.
Highlights:
- Input Type: Directly enter the inequality expression.
- Graph Customization(s): N/A.
- Save Graph: Save as PNG from right-click context menu.
MathPapa.com
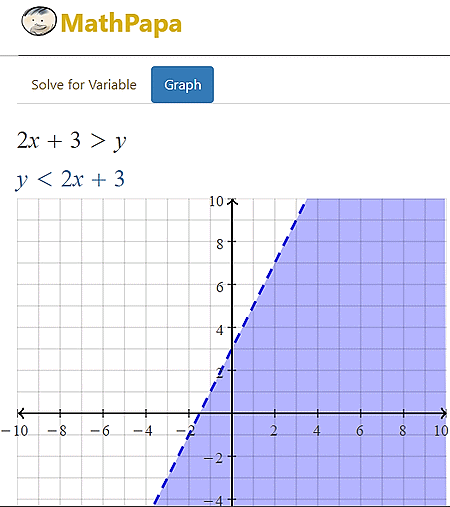
MathPapa.com is a free website that provides math calculators and lessons. There is an Inequality Calculator on this website. This calculator solves the equation for inequality and also plots a graph. You can use this tool to make an inequality graph. You can simply enter an equation and run the calculator to get its solution. The results show you the stepwise solution of the equation and plot a graph of it at the end. It gives you a simple graph that you can neither customize nor save.
How to make an inequality graph online with MathPapa?
- Open this Inequality Calculator using the direct link given below.
- Add the inequality equation to the tool.
- Then click the CALCULATE IT! button to get the solution with a graph.
Highlights:
- Input Type: Directly enter the inequality equation.
- Graph Customization(s): N/A.
- Save Graph: N/A.


About Us

We are the team behind some of the most popular tech blogs, like: I LoveFree Software and Windows 8 Freeware.
More About UsArchives
- May 2024
- April 2024
- March 2024
- February 2024
- January 2024
- December 2023
- November 2023
- October 2023
- September 2023
- August 2023
- July 2023
- June 2023
- May 2023
- April 2023
- March 2023
- February 2023
- January 2023
- December 2022
- November 2022
- October 2022
- September 2022
- August 2022
- July 2022
- June 2022
- May 2022
- April 2022
- March 2022
- February 2022
- January 2022
- December 2021
- November 2021
- October 2021
- September 2021
- August 2021
- July 2021
- June 2021
- May 2021
- April 2021
- March 2021
- February 2021
- January 2021
- December 2020
- November 2020
- October 2020
- September 2020
- August 2020
- July 2020
- June 2020
- May 2020
- April 2020
- March 2020
- February 2020
- January 2020
- December 2019
- November 2019
- October 2019
- September 2019
- August 2019
- July 2019
- June 2019
- May 2019
- April 2019
- March 2019
- February 2019
- January 2019
- December 2018
- November 2018
- October 2018
- September 2018
- August 2018
- July 2018
- June 2018
- May 2018
- April 2018
- March 2018
- February 2018
- January 2018
- December 2017
- November 2017
- October 2017
- September 2017
- August 2017
- July 2017
- June 2017
- May 2017
- April 2017
- March 2017
- February 2017
- January 2017
- December 2016
- November 2016
- October 2016
- September 2016
- August 2016
- July 2016
- June 2016
- May 2016
- April 2016
- March 2016
- February 2016
- January 2016
- December 2015
- November 2015
- October 2015
- September 2015
- August 2015
- July 2015
- June 2015
- May 2015
- April 2015
- March 2015
- February 2015
- January 2015
- December 2014
- November 2014
- October 2014
- September 2014
- August 2014
- July 2014
- June 2014
- May 2014
- April 2014
- March 2014
