6 Best Free Online k-means Calculator Websites
Here are the best free online k-means calculator websites. k-means is a database clustering technique. It is known as k-means clustering. k-mean clustering is an unsupervised machine learning algorithm. This algorithm groups unlabeled datasets into different clusters. It places the datasets with similar characteristics into the same cluster. The number of clusters is pre-defined and represented by “k”. This technique is used to sort raw databases which can lead to the discovery of categories of groups. The algorithm randomly picks k-points or centroids. Then it binds each data point to its closest centroid. This process gets repeated iteratively with the re-assignment of data points until a model is formed.
A k-means calculator performs the k-means clustering. You can add your database to the calculator, select the number of clusters and run perform the calculator. This post covers 6 k-means calculators that you can use online for free. Some of these calculators come with additional options where you can confirm seeding methods, interactions, etc. These calculators also visually represent the clustering with graphs. You can go through the post to check these out in detail.
My Favorite Online k-means Calculator
StatKingdom.com is my favorite k-means calculator website on this list. It is the most comprehensive calculator on this list. The results cover multiple parameters including k-means, SSE, SSG, SST, etc. And it plots a beautiful cluster graph with various options to tweak the appearance. It also plots an elbow chart for optimal values of k.
You can check out our other lists of the best free online Paired T-test Calculator Websites, online F-Distribution Calculator Websites, and online AB Test Calculator Websites.
Table of Content
| Websites | Import Data | Set Iterations | Cluster Graph |
|---|---|---|---|
| StatsKingdom | x | ✓ | ✓ |
| SciStatCalc | ✓ | ✓ | ✓ |
| DataTab | ✓ | ✓ | ✓ |
| ToolSlick | ✓ | ✓ | ✓ |
| RevolEdu | x | x | x |
| Alekseynp | x | x | ✓ |
StatsKingdom.com
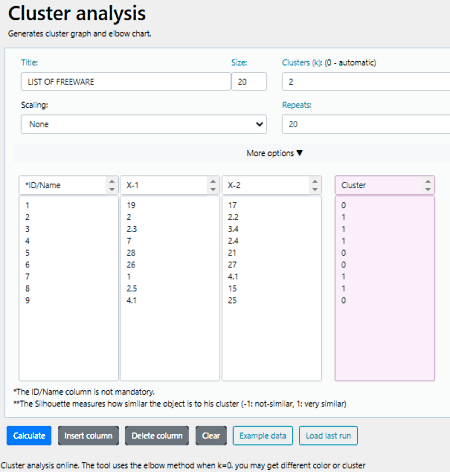
StatsKingdom.com has a free online k-means calculator. This calculator arranges unlabeled data points into clusters. It packs many features and generates a cluster graph and an elbow chart. You can start by adding your dataset to the calculator and then customize various options to tweak the appearance. This includes title, scaling, size, maximum iterations, and various options for chart colors, text styling, cluster styling, and more. With that, it groups the data points and calculates the k-means. One downside of this calculator is that you have to manually add the dataset as there is no option to import the dataset.
How to calculate k-means online on StatsKingdom?
- Open this k-means calculator using the direct link added below.
- Enter the data into the calculator and set the number of clusters.
- Customize the graph and chart appearance options as per your liking.
- Then click the Calculate button to get the output.
Highlights:
- This calculator k-means of an unlabeled dataset.
- It does not have any option to import data, you have to add it manually.
- You can set the maximum number of interactions for clustering.
- It generates a visually customizable cluster graph and elbow chart.
- It offers multiple options to tweak the appearance of the graph and chart.
SciStatCalc.blogspot.com
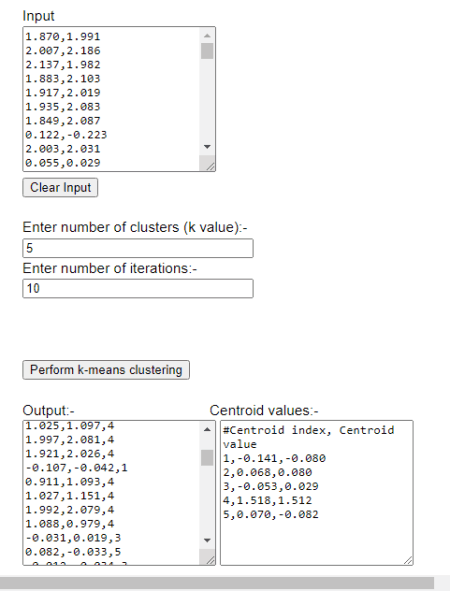
SciStatCalc.blogspot.com is an online blog of Science and Statistics calculators including a k-mean clustering calculator. This calculator clusters a dataset for a given number of clusters and maximum iteration. You just have to provide the dataset. For that, you can either upload the dataset file directly or add the data manually to the calculator. The result of the calculation is a chart and a graph. The chart visualizes the clustering and the graph shows the convergence of the algorithm per iteration.
How to calculate k-means online on SciStatCalc?
- Follow the link given below to open this calculator in your browser.
- Upload your dataset or manually add the data to the calculator.
- Set the number of clusters you want to make along with the maximum number of iterations.
- Then click the Perform k-means clustering button to get the results.
Highlights:
- This calculator k-means of an unlabeled dataset.
- You can upload your dataset file or add data manually.
- You can set the maximum number of interactions and the number of clusters.
- It visualizes the cluster using a graph.
- It also generates a chart to show the algorithm convergence.
DataTab.net
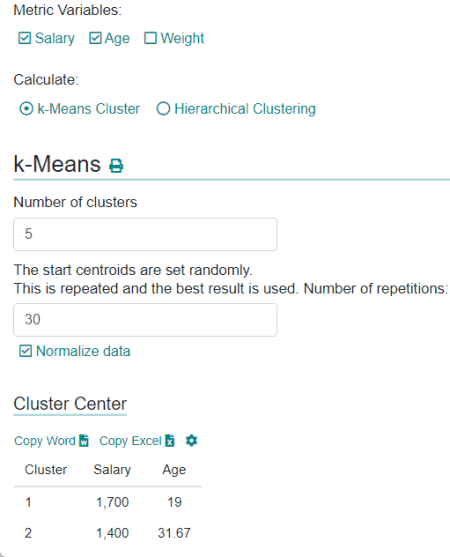
DataTab.net has a free online statistics calculator that can perform various operations including clustering. If you have complex data with many variables then this calculator can be a good choice to go with. It has a spreadsheet where you can easily add and sort your data. Apart from that, you can also import the data from a file and fine-tune that in the sheet for clustering. The calculator offers various types of calculations. You can pick the Cluster calculation. When you do that, it lists the data points of your datasets and asks you to pick the Metric Variable. Then with a given number of clusters and iterations, it gives you the k-means. It shows the clustering in data form that you can export to Word or Excel. Along with that, it also plots an elbow chart visualizing clustering per iteration.
How to calculate k-means online on DataTab.net?
- Use the link given below to open this calculator.
- Use the Import/Export feature to add your data and sort that into the sheet.
- Then click the Cluster button from the bottom.
- After that, select a Metric Variable from the given data points and select the k-means Cluster option.
- After that, enter the number of clusters you want to make along with the maximum number of iterations.
- This gets you the clustering results.
Highlights:
- This calculator k-means of an unlabeled dataset.
- You can upload your dataset file or add data manually.
It has a spreadsheet to easily manage complex datasets. - You can set the maximum number of interactions for clustering of the data.
- It gives the clustering stats that you can copy to Word or Excel.
- It also generates an elbow method chart of iterative clustering.
ToolSlick.com
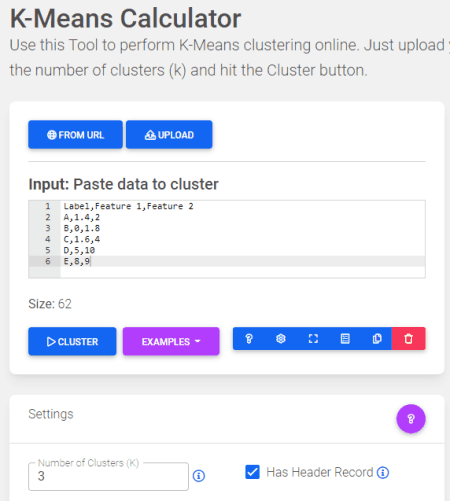
ToolSlick.com is another free online k-means calculator. This calculator offers three clustering algorithms that you can try. As a result, you do not get to set the maximum iterations. Instead, it runs the selected algorithm to get the optimal clustering in as many iterations as required. To use this calculator, you can enter your data directly, import from a URL, or upload a file. With that, you can get the results by setting the number of clusters. It shows the clustering results in a table form. It also shows the raw output data that you can easily copy or export to CSV.
How to calculate k-means online on ToolSlick?
- Go to this k-means calculator using the link provided below.
- Add your dataset to the calculator. You can also use URL import or file upload method to do so.
- Then enter the cluster number and pick a seeding algorithm from the given options.
- After that, click the CLUSTER button to get the results.
Highlights:
- This calculator k-means of an unlabeled dataset.
- There are multiple input methods to add the dataset; URL import, File upload, and manual entry.
- It lets you pick a clustering algorithm hence no option to set the maximum number of iterations.
- In the end, you can download clustering data as a CSV file.
RevolEdu.com
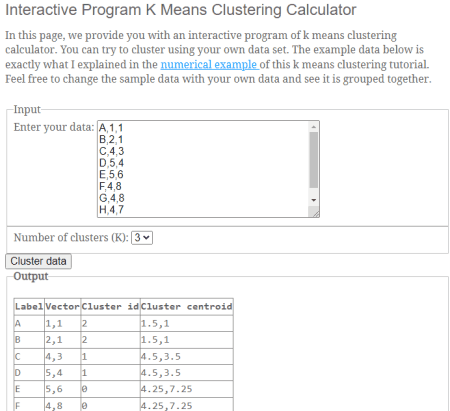
RevolEdu.com also offers a free online k-means calculator. This is one of the simplest calculators on this list. You can simply paste your data into the calculator, set the number of clusters, and get the output. It shows the clustering results in a tabular data form. There you can see which data points landed in which cluster. That’s pretty much all.
How to calculate k-means online on RevolEdu.com?
- Follow the link provided below to open this calculator directly.
- Add your data to the calculator.
- Then set the number of clusters you want to make.
- After that, click the Cluster data button to get the output.
Highlights:
- This calculator k-means of an unlabeled dataset.
- No import options; you can paste the data directly into the calculator.
- No option to set the maximum number of iterations.
- Shows the clustering data in a tabular format and not a graph or chart.
Alekseynp.com
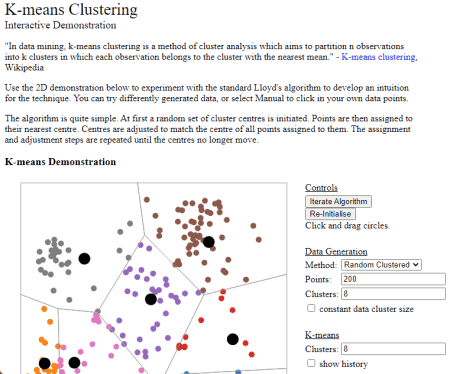
Alekseynp.com offers a free online k-means demonstration tool. You can use this tool to visualize the k-means clustering algorithms using visual representation. It does not take data input. Instead, you can set the number of data points and the number of clusters you want to make. It supports three data point generation methods. You can pick a method of your choice and iterate the algorithm to start the demonstration. This tool does not give any data output. It just divides the data points into clusters and then moves the k-points to ideal positions.
How to demonstrate k-means online on Alekseynp?
- Use the link added below to go to this calculator online.
- In the Data Generation section, set the number of data points.
- Then set the number of clusters and click Iterate Algorithm.
Highlights:
- This calculator visually represents the clustering of sample datasets.
- It offers three sample data generation methods that you can try.


About Us

We are the team behind some of the most popular tech blogs, like: I LoveFree Software and Windows 8 Freeware.
More About UsArchives
- May 2024
- April 2024
- March 2024
- February 2024
- January 2024
- December 2023
- November 2023
- October 2023
- September 2023
- August 2023
- July 2023
- June 2023
- May 2023
- April 2023
- March 2023
- February 2023
- January 2023
- December 2022
- November 2022
- October 2022
- September 2022
- August 2022
- July 2022
- June 2022
- May 2022
- April 2022
- March 2022
- February 2022
- January 2022
- December 2021
- November 2021
- October 2021
- September 2021
- August 2021
- July 2021
- June 2021
- May 2021
- April 2021
- March 2021
- February 2021
- January 2021
- December 2020
- November 2020
- October 2020
- September 2020
- August 2020
- July 2020
- June 2020
- May 2020
- April 2020
- March 2020
- February 2020
- January 2020
- December 2019
- November 2019
- October 2019
- September 2019
- August 2019
- July 2019
- June 2019
- May 2019
- April 2019
- March 2019
- February 2019
- January 2019
- December 2018
- November 2018
- October 2018
- September 2018
- August 2018
- July 2018
- June 2018
- May 2018
- April 2018
- March 2018
- February 2018
- January 2018
- December 2017
- November 2017
- October 2017
- September 2017
- August 2017
- July 2017
- June 2017
- May 2017
- April 2017
- March 2017
- February 2017
- January 2017
- December 2016
- November 2016
- October 2016
- September 2016
- August 2016
- July 2016
- June 2016
- May 2016
- April 2016
- March 2016
- February 2016
- January 2016
- December 2015
- November 2015
- October 2015
- September 2015
- August 2015
- July 2015
- June 2015
- May 2015
- April 2015
- March 2015
- February 2015
- January 2015
- December 2014
- November 2014
- October 2014
- September 2014
- August 2014
- July 2014
- June 2014
- May 2014
- April 2014
- March 2014
