7 Best Free Online Stem and Leaf Plot Calculator Websites
Here is a list of best free online stem and leaf plot calculator websites. Stem and Leaf plot is a type of data visualization tool that helps users visualize and understand the distribution of numerical data. It represents the numerical data in a tabular form where data is split into leaf and stem columns. In the stem and leaf plot, the first digit is written as stem and the last digit is written as a leaf. Steam and Leaf plots are used to estimate various statistics like Median, Mode, Range, Percentiles, and more. There are many use cases for stem and leaf plots like Comparing Datasets, Calculation of Basic Statistics, Visualization of Data Distribution, and more. If you also want to calculate and generate stem and leaf plot diagrams, check out these online stem and leaf plot calculator websites.
Through these websites, users can quickly generate stem and leaf plot diagrams using a set of numerical values. Some websites also support data copied from Excel sheets. Apart from generating a stem and leaf plot diagram, some websites also perform various statistical calculations like Mean, Mode, Median, Range, Count, Sum, Standard Deviation, Variance, etc. A few websites also explain the calculation process and highlight all the formulas used in the calculation. To help new users, I have included basic calculation steps in the description of each website. Go through the list to learn more about these tools.
My Favorite Online Stem and Leaf Plot Calculator Website:
calculatorsoup.com is my favorite website as it generates stem and plot diagrams and calculates multiple statistics like Mean, Standard Deviation, etc. It also highlights all the formulas used in the calculation.
You can also check out lists of best free Online Dot Plot Maker, Online Joint Probability Calculator, and Online Binomial Probability Calculator websites.
Comparison Table:
| Features/Website Names | Supports negative data set values | Calculate multiple statistics | Shows calculation formulas |
|---|---|---|---|
| calculatorsoup.com | ✓ | ✓ | ✓ |
| statskingdom.com | x | x | x |
| calculator-online.net | x | ✓ | x |
| atozmath.com | x | ✓ | ✓ (shows entire solution) |
| calculator.com | x | x | x |
| mathcracker.com | x | x | ✓ (shows solution steps) |
| statology.org | x | x | x |
calculatorsoup.com
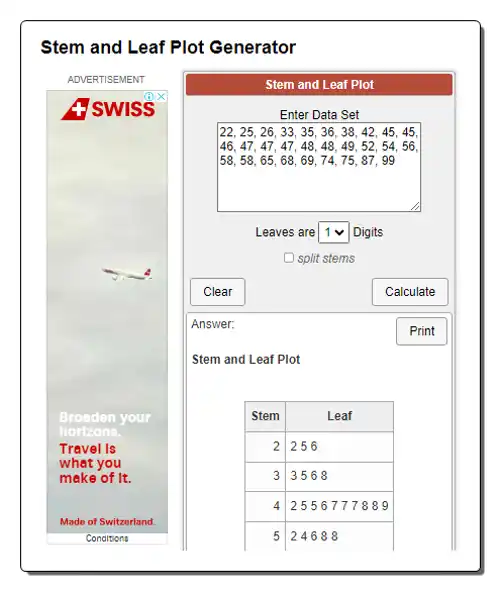
calculatorsoup.com is a free online stem and leaf plot calculator website. This calculator can work with both positive and negative data set values. Plus, users can directly copy data from Excel and paste it into this website as input. Before starting the calculation, users can choose a leaf of up to 4 digits. After the calculation, it generates a Stem and Leaf plot diagram and shows various calculated statistics like Range, Count, Sum, Mean, Median, Standard Deviation, Variance, and more. This website shows all the formulas that it uses in the calculation. Now, follow the below steps.
How to perform stem and leaf plot calculation online using claculatorsoup.com:
- Visit this website and open up the Stem and Leaf plot Generator.
- After that, manually enter or paste the input data set values separated by commas.
- Next, enter the leaf digits.
- Now, click on the Calculate button to start the calculation process.
- Finally, view the stem and leaf plot diagram and all the calculated statistics.
Additional Features:
- This website offers multiple statistics calculators like Average, Basic Statistics, Character Counter, Word Counter, Descriptive Statistics, Coin Flipper, GPA Calculator, and more.
Final Thoughts:
It is one of the best free online stem and leaf plot calculator websites that generates stem and leaf plot graphs and shows all the calculated statistics.
| Pros | Cons |
|---|---|
| Supports negative data set values | |
| Shows all the calculated statistics | |
| Highlights all the formulas used in the calculation |
statskingdom.com
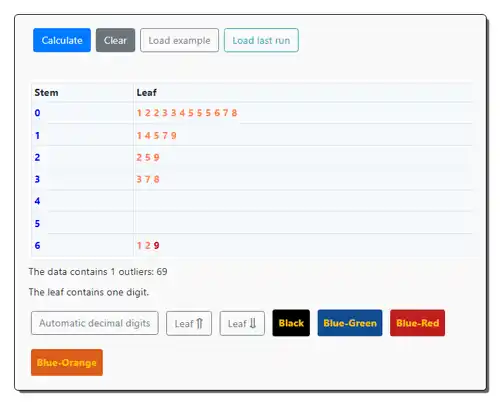
statskingdom.com is another free online stem and leaf plot calculator. This website offers a simple stem and leaf plot generator that allows users to convert their input data set values to stem and leaf charts. Before starting the calculation, users can specify the leaf digit that can be varied from 1 to 9. It can also detect and highlight outliers if users want. I also like its ability to assign unique colors to Stem, Leaf, and Outlier values. Some advanced tools to specify digits after the decimal, data delimiters, and leaves delimiters are also present. Now, follow the below steps.
How to perform stem and leaf plot calculation online using statskingdom.com:
- Go to this website and access the Stem and Leaf Plot calculator.
- After that, submit the input data set in the data field.
- Next, choose a leaf digit and specify delimiter types.
- Finally, click on the Calculate button to start the calculation process.
Additional Features:
- This website offers steps to generate stem and left plot diagrams.
- It also explains stem and leaf plots to users.
- A good set of additional calculators are present on this website like Average, Boxplot, Venn Diagram, PCA, Cluster Analysis, and more.
Final Thoughts:
It is another good online stem and leaf plot calculator website that helps users quickly generate a stem and leaf plot diagram based on the input data set values.
| Pros | Cons |
|---|---|
| Shows steps to generate stem and leaf plot diagram | |
| Assigns unique colors to Stem, Leaf, and Outlier values | |
| Highlights Outlier values |
calculator-online.net
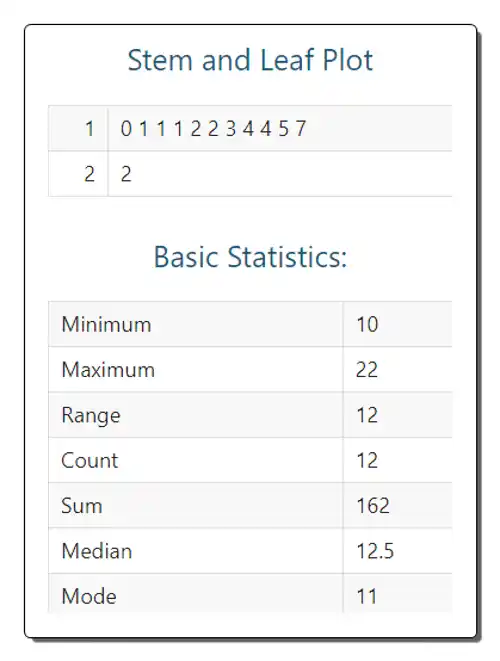
calculator-online.net is another free online stem and leaf plot calculator website. This website offers a simple and effective Stem and Leaf plot calculator that uses a set of numerical data to generate a stem and leaf plot diagram and calculate basic statistics like Range, Count, Sum, Median, Mode, Standard Deviation, Variance, and more.
This website also explains stem and leaf plots with examples. To help new users, it provides the steps to read and understand stem and leaf plot diagrams. Steps to generate leaf plots are also provided. It also answers multiple common queries associated with this topic. Now, follow the below steps.
How to perform stem and leaf plot calculation online using calculator-online.net:
- Launch this website using the given link.
- After that, write or paste the input numerical data.
- Next, tap on the Calculate button to start the calculation process.
- Finally, view the stem plot and basic statistics.
Additional Features:
- This website covers multiple calculator categories like Health, Math, Finance, Informative, Physics, Chemistry, Statistics, and more.
Final Thoughts:
It is another good online stem and leaf plot calculator website that generates stem plots and shows standard statistics.
| Pros | Cons |
|---|---|
| Generates leaf plot diagram | |
| Calculate various statistics |
atozmath.com
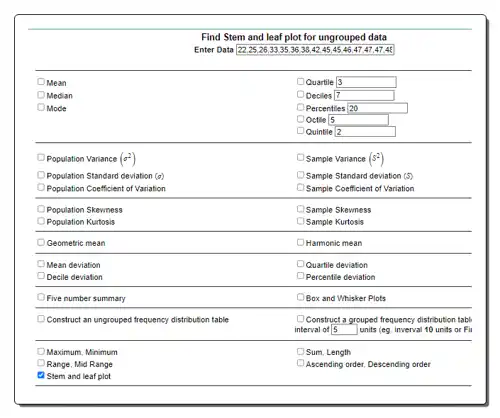
atozmath.com is another free online stem and leaf plot calculator website. This website offers multiple statistical calculator websites, including a stem and leaf plot calculator. This calculator uses input data set values separated by commas to generate an appropriate stem and lead plot diagram. However, it doesn’t let users manually specify the leaf value.
This calculator calculates and shows basic statistics like Count, Minimum Value, Maximum Value, Mean, Mode, Median, Standard Deviation, etc. However, users can choose to calculate additional statistics like Quartile, Deciles, Sample Variance, Geometric Mean, Harmonic Mean, and more. It can also show the solutions of the calculated statistics. However, users need to click on ads to view all the solutions. Now, follow the below steps.
How to perform stem and leaf plot calculation online using atozmath.com:
- Go to this website and access the Stem and Leaf plot option.
- Now, enter the data set values separated by commas.
- Next, enable the additional statistics you want to calculate from its main interface.
- Finally, tap on the Find button to view the stem and leaf plot diagram and statistics.
Additional Features:
- This website offers multiple online calculators covering fields like Calculus, Geometry, Word Problems, Operation research, College Algebra, and more.
Final Thoughts:
It is another good online stem and leaf plot calculator website that generates the stem and leaf plot diagram and shows various statistics.
| Pros | Cons |
|---|---|
| Shows steps to generate stem and leaf plot diagram | Users need to click on ads to view solutions |
| Can calculate additional statistics |
calculator.com
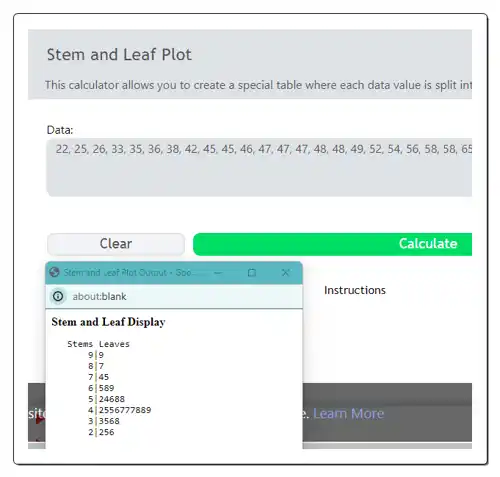
calculator.com is another free online stem and leaf plot calculator website. This website generates a stem and leaf plot special table where each data value is split into a stem and leaf. However, it doesn’t calculate any additional statistics like other similar websites. Users cannot specify leaf value as well. Now, follow the below steps.
How to perform stem and leaf plot calculation online using calculator.com:
- Go to this website using the given link.
- After that, choose Stem and Leaf Plot tool.
- Now, enter the data set in the input field.
- Next, click on the Calculate button to view the stem and leaf plot diagram.
Additional Features:
- This website offers additional calculators like Percentage, Cosine, Expression Solver, Prime Number, Pythagorean Theorem, Tangent, and more.
Final Thoughts:
It is one of the simplest online stem and leaf plot calculators that only generates a basic stem and leaf plot diagram.
| Pros | Cons |
|---|---|
| Doesn’t calculate any statistics | |
| Users cannot specify leaf values |
mathcracker.com
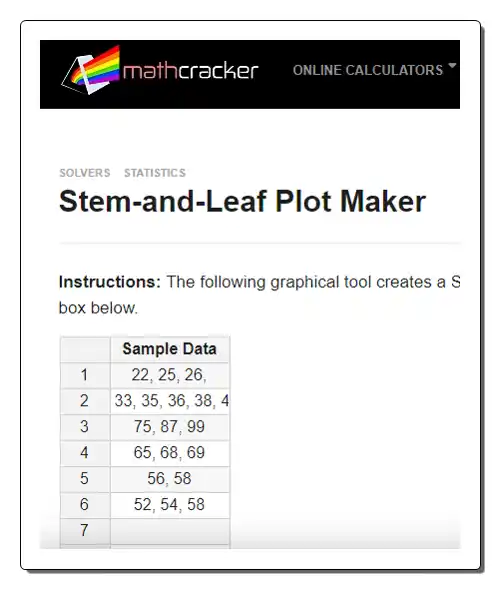
mathcracker.com is another free online stem and leaf plot calculator website. This website helps users create a stem and leaf plot diagram using the input data. It can accept up to 20 values at a time. Before starting the calculation, users can also specify the name of the variable. After the calculation, it shows the steps that it takes to reach the final stem and leaf plot diagram. It also describes the stem and leaf plot in brief. Now, follow the below steps.
How to perform stem and leaf plot calculations online using mathcracker.com:
- Visit this website and access the stem and leaf plot maker.
- Now, enter data in the sample data field.
- Next, name the variable and tap on the Calculate it button to start the calculation process.
- Finally, view the stem and leaf plot diagram with the solution.
Additional Features:
- On this website, users can find handy tools like Statistics Solver, Graphing Tool, Basic Statistics Package, Box Chart Maker, Pie Chart Maker, and more.
Final Thoughts:
It is another good online stem and leaf plot calculator that also shows the steps that it takes to reach the final stem and leaf plot diagram.
| Pros | Cons |
|---|---|
| Shows solution steps | Only accepts up to 20 values |
statology.org
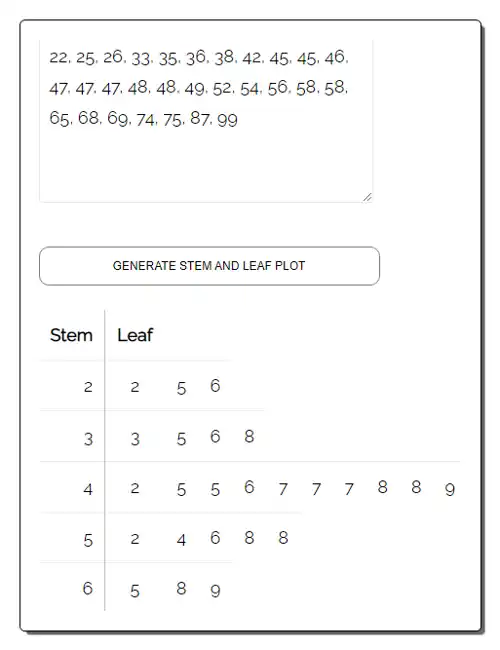
statology.org is the last free online stem and leaf plot calculator website. Through this website, users can quickly generate a stem and leaf plot diagram using the input data. Users can submit multiple numerical values separate by commas into this tool. It also provides a tutorial to help users create stem and leaf plot diagrams by hand. However, it doesn’t perform any statistics calculations. Now, follow the below steps.
How to perform stem and leaf plot calculations online using statology.org:
- Visit this website and look for Stem and Leaf Plot Generator.
- After that, paste or manually write the input data set.
- Next, tap on the Generate Stem and Leaf plot button.
- Finally, view the diagram.
Additional Features:
- This website offers multiple calculators based on Ctirical Score to P value, Critical Value Finder, Probability, Sample Size, and Time Series topics.
Final Thoughts:
It is another good online stem and leaf plot calculator that quickly generates a stem and leaf plot diagram using the input values.
| Pros | Cons |
|---|---|
| It provides a tutorial to calculate stem and leaf plots by hand | |
| Easy to use |
Frequently Asked Questions
In a stem-and-leaf plot, the range refers to the difference between the largest and smallest values in the dataset. Since the plot conveniently orders the values, finding the range becomes quite straightforward.
While a stem-and-leaf plot does share some characteristics with a table, it wouldn't technically be considered a table itself because a table follows a rigid grid format with fixed rows and columns, while a stem-and-leaf plot arranges data based on the "stem" and "leaf" division, creating a dynamic structure. Tables aim to present data clearly and concisely, while stem-and-leaf plots focus on visualizing the distribution of data, highlighting features like central tendency and spread.
Stem-and-leaf plots offer a quick and concise way to view the distribution of a dataset without the need for complex calculations or extensive numerical tables. This makes them particularly useful for getting an initial understanding of the data. Unlike other graphical representations, such as histograms, stem-and-leaf plots retain the individual data points. This allows for a more detailed examination of the actual values in the dataset, which can be important in certain contexts.
The primary function of a stem-and-leaf plot is to provide a visual representation of a dataset. It displays individual data points in a structured manner, allowing for a quick overview of the distribution.


Naveen Kushwaha
Passionate about tech and science, always look for new tech solutions that can help me and others.
About Us

We are the team behind some of the most popular tech blogs, like: I LoveFree Software and Windows 8 Freeware.
More About UsArchives
- May 2024
- April 2024
- March 2024
- February 2024
- January 2024
- December 2023
- November 2023
- October 2023
- September 2023
- August 2023
- July 2023
- June 2023
- May 2023
- April 2023
- March 2023
- February 2023
- January 2023
- December 2022
- November 2022
- October 2022
- September 2022
- August 2022
- July 2022
- June 2022
- May 2022
- April 2022
- March 2022
- February 2022
- January 2022
- December 2021
- November 2021
- October 2021
- September 2021
- August 2021
- July 2021
- June 2021
- May 2021
- April 2021
- March 2021
- February 2021
- January 2021
- December 2020
- November 2020
- October 2020
- September 2020
- August 2020
- July 2020
- June 2020
- May 2020
- April 2020
- March 2020
- February 2020
- January 2020
- December 2019
- November 2019
- October 2019
- September 2019
- August 2019
- July 2019
- June 2019
- May 2019
- April 2019
- March 2019
- February 2019
- January 2019
- December 2018
- November 2018
- October 2018
- September 2018
- August 2018
- July 2018
- June 2018
- May 2018
- April 2018
- March 2018
- February 2018
- January 2018
- December 2017
- November 2017
- October 2017
- September 2017
- August 2017
- July 2017
- June 2017
- May 2017
- April 2017
- March 2017
- February 2017
- January 2017
- December 2016
- November 2016
- October 2016
- September 2016
- August 2016
- July 2016
- June 2016
- May 2016
- April 2016
- March 2016
- February 2016
- January 2016
- December 2015
- November 2015
- October 2015
- September 2015
- August 2015
- July 2015
- June 2015
- May 2015
- April 2015
- March 2015
- February 2015
- January 2015
- December 2014
- November 2014
- October 2014
- September 2014
- August 2014
- July 2014
- June 2014
- May 2014
- April 2014
- March 2014
