6 Best Free Crash Dump Analyzer Software For Windows
This article contains a list of best free crash dump analyzer software for Windows. Using these crash dump analysis software, you can get a detailed report on what caused your computer or an application to crash.
Most of them are minidump viewer software which let you view minidump files (.dmp), which are written each time your computer crashes. By default, .dmp files are stored at C:\Windows\MiniDump location in your PC. Other freeware in this list scan running applications/processes in order to display respective crash dump reports, in case they stop responding abruptly.
The report generated by these crash dump analyzer software includes information like exception error, exception code, dump class, dump qualifier, dump type, faulting IP, primary problem class, failure bucket ID, failure ID hash string, crash time, bug check string, bug check code, parameters, caused by driver, crash address, etc. By evaluating the crash dump report, you can take actions accordingly to make sure that your system works properly.
The generated crash report can be saved in formats of CSV, TXT, XML, and HTML, in most of these software.
Note: To view crash reports, make sure that your PC is configured to save minidump files by going to System Properties > Advanced tab > Startup and Recovery settings.
My Favorite Free Crash Dump Analyzer Software For Windows:
BlueScreenView is my favorite crash dump analyzer software in this list. It performs detailed memory dump analysis and generates crash report, which can be exported in HTML format.
You can also checkout the lists of File Recovery Software, Registry Cleaner Software, and PC Optimization Software for Windows.
WinDbg
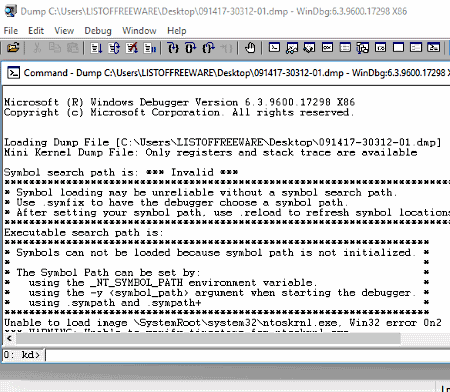
WinDbg is a debugging tool for Windows. It comes in a package called Windows Software Development Kit (SDK), along with other debugging tools. While installing SDK, make sure you have have marked check on Debugging Tools for Windows feature to install for crash dump analysis.
As you launch WinDbg, go to File > Open Crash Dump. This will let you open and analyze a minidump file (DMP) saved on your PC. As you open a minidump file, whole crash report is generated and displayed in a window.
- In this report, you can view general information related to a computer crash like debug session time, system uptime, built by, kernel base, etc.
- For detailed information, click on ‘!analyze -v’ in Bugcheck Analysis section. Now, you can view a full crash dump report which includes information regarding exception error, arguments, exception code, dump class, dump qualifier, dump type, faulting IP, primary problem class, failure bucket ID, failure ID hash string, and more.
You can analyze these information in order to know what went wrong. In case of trouble in crash dump analysis, check here.
WindDbg is a good crash dump analyzer. It lets you evaluate minidump files. You can also use its command line mode for memory dump analysis.
BlueScreenView
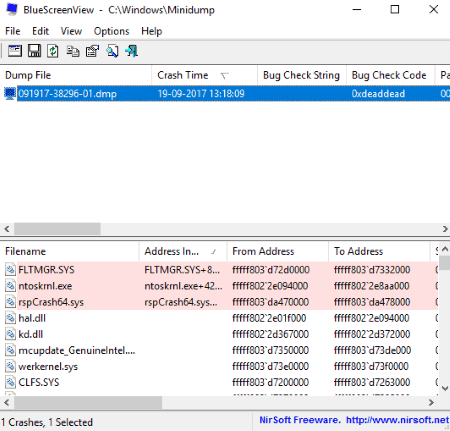
BlueScreenView is a free crash dump analyzer software for Windows. When your computer crashes, it displays a blue screen which is called Blue Screen of Death (BSoD). And, each time your computer crashes, a minidump file (DMP) is created and saved at default location in your PC (C:\Windows\MiniDump), as long as your system is configured to store DMP files. Using this software, you can view these crash dump files and get information regarding causes of blue screen.
By default, it displays minidump files stored in default location on your PC. You can change this default location, or even load a single minidump file (DMP) saved at different location on your computer. These settings are accessible by using Advanced Options tool provided on its interface.
All minidump files are shown on its interface. You can select one at a time to get information about respective computer crash. It displays different information in tabular form on its main interface, which include Crash Time, Bug Check String, Bug Check Code, Parameters, Caused by Driver, Caused by Address, Crash Address, Processor Count, Major Version, Minor Version, Dump File Size, Dump File Time, etc. All these information help you in understanding reason of system crashes.
A HTML report can be generated including all these information regarding computer crash.
It is a good minidump viewer which lets you view and analyze crash dumps files saved in your PC. It comes in portable version and has a user friendly interface. To know more about it, see here.
WhoCrashed
WhoCrashed is another crash dump analyzer for Windows. It is basically a minidump viewer software, and is free only for personal use.
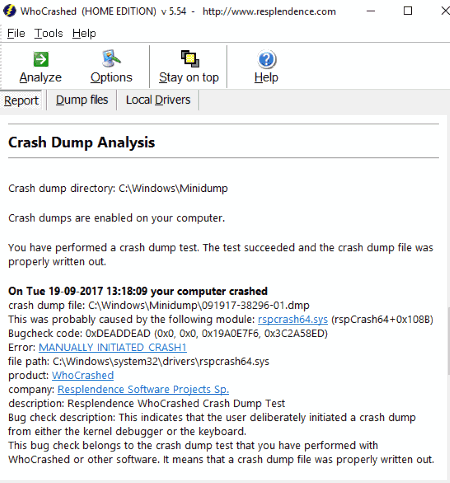
To get the computer crash reports, click on Analyze button present on its interface. This will let it load all minidump files written at default location in your computer, and display information related to respective system crashes. You can choose number of recent crash reports to view by going to Options menu.
In the Report tab, scroll down to Crash Dump Analysis section. There, you will find all reports related to each computer crash with date and time of its occurrence. In this report, information including possible module responsible for crash, bug check code, bug check description, error (e.g. SYSTEM_SERVICE_EXCEPTION), file path, product, company, etc. are shown. You can also know more about the bugs on web by clicking on the respective links.
There is also a Conclusion section in Report tab, where the software displays conclusion on all computer crashes and recommends suggestions to prevent computer crashes. You can also view local drivers which are responsible for causing computer crashes.
The crash dump reports can be exported as a HTML file.
It has an option to let you run a crash dump test to check an example of crash report generated by it.
WhoCrashed is a basic crash dump analysis software which provides brief information related to each computer crash occurred. The detailed crash dump report is only provided in the paid version of this software.
AppCrashView
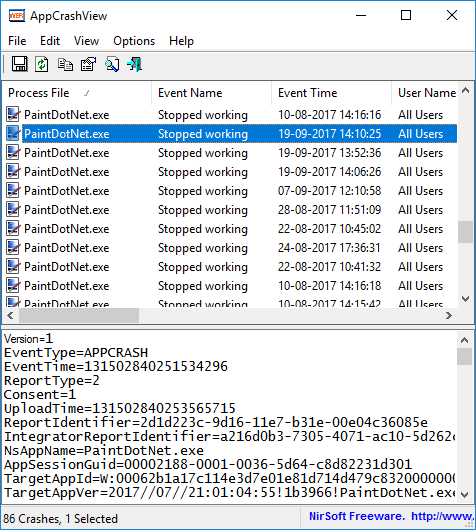
AppCrashView is a free and portable crash dump analyzer software for Windows. It is a simple utility software which displays information regarding application crashes. It is done by fetching information from Windows Error Reporting files (.wer).
It displays a list of processes which crashed in the upper panel of its interface. There you can view information like event name, event time, exception code, exception offset, fault module name, fault module version, etc.
To see detailed crash dump report, select a process name. It will display the crash report in the lower pane of its interface. This report includes event type, loaded modules (dll files), error popups, report identifier, fault module timestamp, metadata hash, etc.
You can save the tabular crash report in formats of TXT, CSV, HTML, and XML. You can choose columns to include in the output file.
AppCrashView is another nice option for a crash dump analyzer in this list. It is lightweight and easy to use.
WinCrashReport
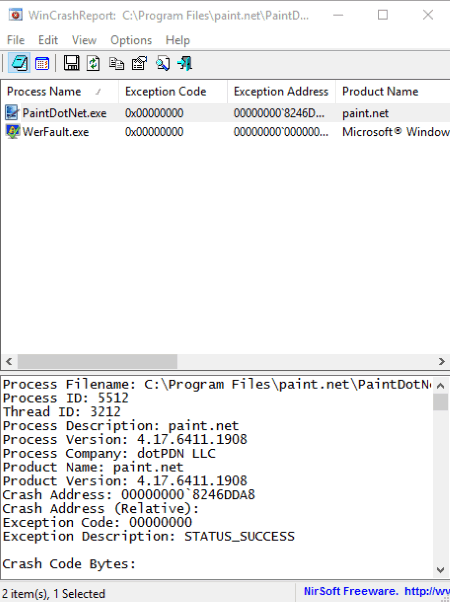
WinCrashReport is another utility program which is used for analyzing crash dump. It doesn’t view minidump files, but generates a report regarding a crashed application on your system. For that, you need to keep it open on your system. As soon as an application crashes, it displays about the same on its interface. A table shows properties like exception code, exception address, product name, file version, etc. Detailed information is displayed at the bottom of its interface, which includes complete crash report. Here, you can view thread ID, crash address, crash code bytes, strings in the stack, module list, full stack data, etc.
You can view the crash report, and even save it in simple text format or HTML format; choice is yours. The general information displayed in tabular form can be exported as CSV, TXT, HTML, and XML formats.
Like many other crash dump analysis software, it also comes in portable version. You can add it to your system tray to easily access it.
WhatIsHang
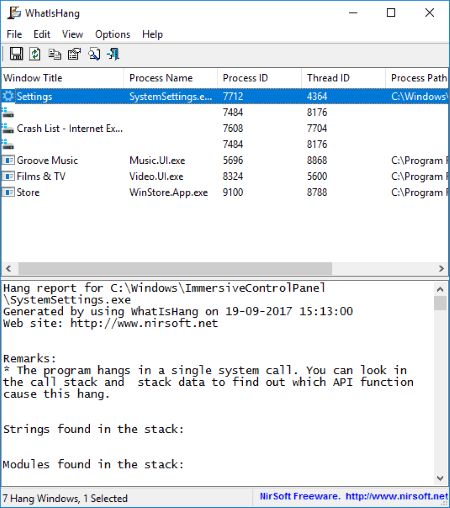
WhatIsHang is yet another crash dump analyzer software for Windows. As its name suggests, it basically analyzes the currently hung processes or applications and returns the crash report in real-time.
It displays the processes which currently stopped responding abruptly, with process name, process ID, thread ID, and process path. To get hang information, simply press F9 key or go to to File > Get Hang Information. In the section below its interface, it displays the full error report which includes remarks, modules found in the stack, execute address, stack data, call stack, processor registers, memory data, etc. You can use strings and dll files information related to hang issues in order to analyze the crash dump better.
The hang information can be saved as CSV, TXT, HTML, or XML file.
WhatIsHang simply shows reports regarding the processes or software being hanged or closed abruptly on your PC. It doesn’t read and view minidump files related to computer crashes.
About Us
We are the team behind some of the most popular tech blogs, like: I LoveFree Software and Windows 8 Freeware.
More About UsArchives
- May 2024
- April 2024
- March 2024
- February 2024
- January 2024
- December 2023
- November 2023
- October 2023
- September 2023
- August 2023
- July 2023
- June 2023
- May 2023
- April 2023
- March 2023
- February 2023
- January 2023
- December 2022
- November 2022
- October 2022
- September 2022
- August 2022
- July 2022
- June 2022
- May 2022
- April 2022
- March 2022
- February 2022
- January 2022
- December 2021
- November 2021
- October 2021
- September 2021
- August 2021
- July 2021
- June 2021
- May 2021
- April 2021
- March 2021
- February 2021
- January 2021
- December 2020
- November 2020
- October 2020
- September 2020
- August 2020
- July 2020
- June 2020
- May 2020
- April 2020
- March 2020
- February 2020
- January 2020
- December 2019
- November 2019
- October 2019
- September 2019
- August 2019
- July 2019
- June 2019
- May 2019
- April 2019
- March 2019
- February 2019
- January 2019
- December 2018
- November 2018
- October 2018
- September 2018
- August 2018
- July 2018
- June 2018
- May 2018
- April 2018
- March 2018
- February 2018
- January 2018
- December 2017
- November 2017
- October 2017
- September 2017
- August 2017
- July 2017
- June 2017
- May 2017
- April 2017
- March 2017
- February 2017
- January 2017
- December 2016
- November 2016
- October 2016
- September 2016
- August 2016
- July 2016
- June 2016
- May 2016
- April 2016
- March 2016
- February 2016
- January 2016
- December 2015
- November 2015
- October 2015
- September 2015
- August 2015
- July 2015
- June 2015
- May 2015
- April 2015
- March 2015
- February 2015
- January 2015
- December 2014
- November 2014
- October 2014
- September 2014
- August 2014
- July 2014
- June 2014
- May 2014
- April 2014
- March 2014
