8 Best Free Line Graph Maker Software For Windows
Here is a list of Best Free Line Graph Maker Software For Windows. These freeware are helpful in creating simple as well as complicated line graphs i.e. multi-series line graphs. A line graph helps you visualize data series in the form of a line connected by different data points. Using these, you can create a line graph of various subtypes such as points only, points and lines, lines only, 3D lines, stacked line graph, 100% stacked line graph, etc. Additionally, the ability to customize line graphs as per your requirements make these software desirable line graph generators.
Most of these are office software which let you create a spreadsheet and draw a corresponding line graph. While doing so, these let you customize data range, data series, chart elements (axes, legends, etc.), etc. To create more informative line graphs, you can also insert trendline, mean value, X/Y error bars, etc. You can also format the line properties (line type, line style, line width, transparency, etc.), chart area, chart wall properties, text and font, etc.
To export line graph, most of these support formats like PNG, BMP, JPG, GIF, WMF, TIF, SVG, PDF, etc.
My Favorite Line Graph Maker Software For Windows
LibreOffice is my favorite line graph maker as you can create a line graph as well as a combination of column and line graph using it. It provides a good range of chart customization features too. If you want to create a line graph of various subtypes, go for SoftMaker FreeOffice.
You may also like some best free Organizational Chart Makers, Spreadsheet Software, Bar Chart Makers, and Gantt Chart Creators for Windows.
LibreOffice
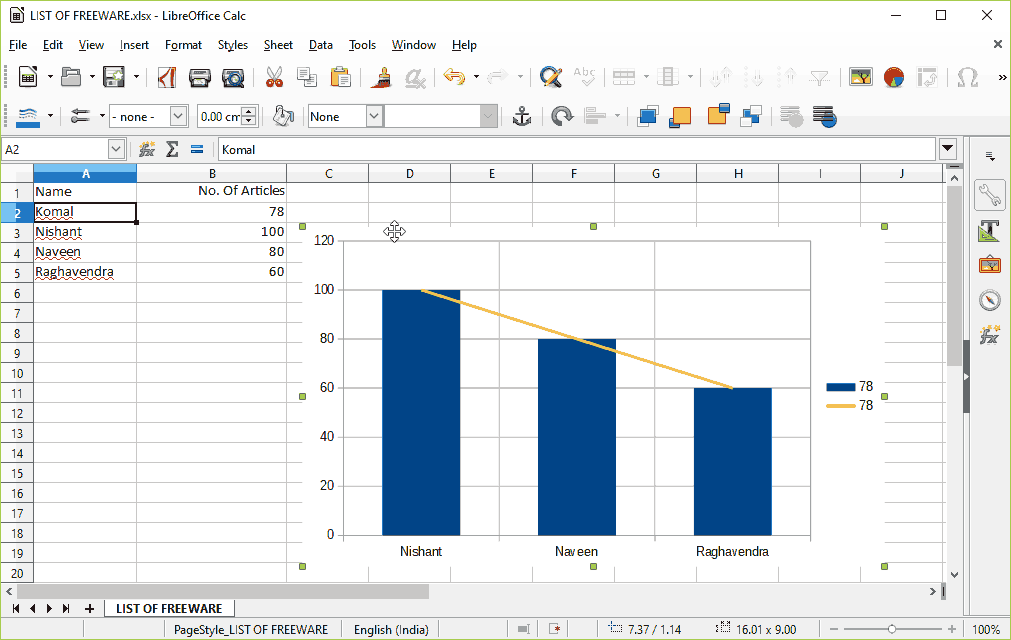
LibreOffice is a feature rich office suite which can be used for various utilities like creating spreadsheets, documents, presentations, diagrams, etc. It also lets you create a line graph as well as other types of graphs such as bar, column, pie, area, bubble, net, stock, etc. The good thing about this line graph maker software is that it can create a combination of column and line graphs too (click on above screenshot).
How to create a line graph and “column and line” graph in LibreOffice
- Open its application LibreOffice Calc and create a spreadsheet with data entries. You can also import an existing spreadsheet in XML, XLS, XLT, ETT, DIF, WKS, ODS, etc. formats.
- Now, select the data entries and go to Insert > Chart option.
- From the opened Chart Wizard, you can choose graph type as line graph or “column and line” graph. After that, customize data range, data series, and chart elements and click on Finish button to draw a line graph.
Options to customize a line graph:
- You can choose a subtype of line graph from points only, points and lines, lines only, and 3D lines. As for a column and line graph, it provides two subtypes named “columns and lines” and “stacked columns and lines”.
- To make a line graph more informative, you can add titles to graph, axes, and secondary axes. Also, you can insert trendline, mean value, X/Y error bars, etc. legends.
- It lets you customize line properties for creating a line graph such as line type (straight, smooth, stepped), line style, arrow style, line width, transparency, corner style, cap style, etc.
- You can also format line chart by customizing chart wall properties, colors, text effects, etc.
While you make changes to the line graph, the preview of the same is shown in real time.
LibreOffice provides flexibility to save line graph in PNG, BMP, JPG, GIF, WMF, TIF, SVG, PDF, etc. formats. Or, you can even save the whole spreadsheet with line graph as ODS, XLSX, XML, CSV, etc. files.
As a line graph generator, LibreOffice is one of the best as you don’t get such wide range of line graph customization features and export formats in any other line chart maker software.
SoftMaker FreeOffice
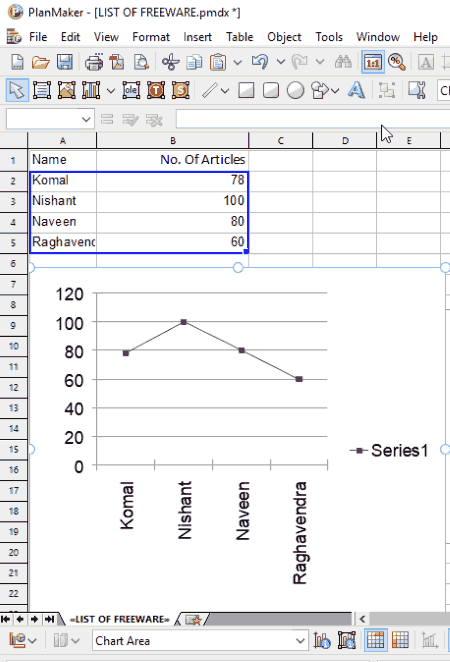
SoftMaker FreeOffice is a free office software for Windows. It can also be used to create a line graph. PlanMaker is an application of this software which lets you create spreadsheets. You can draw line graph for any of the created or imported spreadsheets. Select the data entries in the spreadsheet and click on New Chart Frame option from Object menu. A “Chart Properties” window will open up. From here, you can select chart type as line graph. Additionally, you can also select a desired subtype of line graph including lines with markers, 3D lines, lines only, stacked line graph, 100% stacked line graph, etc. After that, you need to modify parameters like data source area, data series, etc. The preview of line graph is shown in real time in the same window.
This line graph maker lets you select desired color palette (bright color, pastel color, etc.) to plot a line chart. Also, you can format line properties, text and font, plot area properties, 3D view properties, etc. You can also annotate line graph using drawings like line, curve, freehand, rectangle, text arts, etc.
PNG, JPG, BMP, GIF, and TIF image formats are supported by this software to save the line graph.
It is very well capable of creating area, bubble, radar, scatter, doughnut, etc. charts too.
Gnumeric Spreadsheet
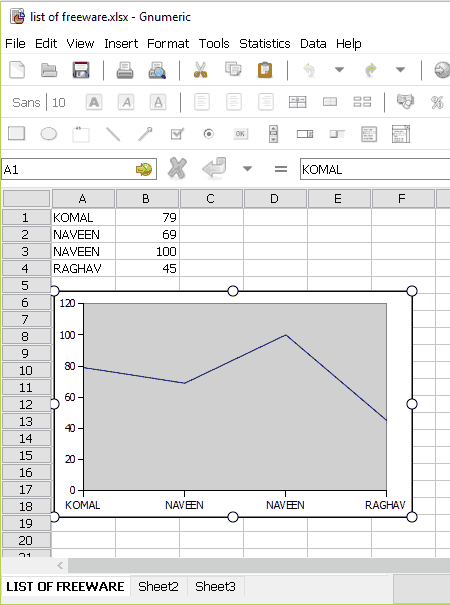
Gnumeric Spreadsheet is basically used to create spreadsheets. Using it, you can create a line graph as well as column, pie, contour, drop bar, matrix, surface, ring, radar, polar, etc. charts. After creating a spreadsheet with various data entries, select the entries and use Insert > Chart option. Now, choose line graph type and its subtype (lines with markers, stacked line graph, unmarked line graph, etc.). You can choose series as rows or columns.
It lets you customize backplane, axes, plotline, etc. elements of the line graph. The theme and style of graph can be formatted too including title of graph, font, layout, style, text orientation, effective area, etc. properties.
After customizing line graph, you can export it in PNG, SVG, JPEG, PDF, EPS, PS, etc. formats.
WPS Office
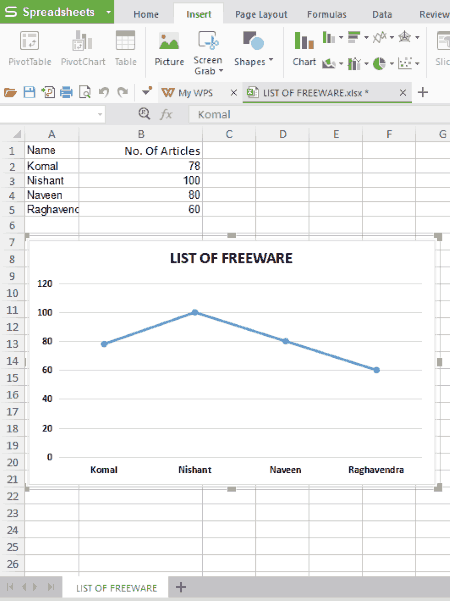
WPS Office is yet another office suite which can be used to create a line graph. Its spreadsheet application can be used to do so. Just create or import a spreadsheet, select data entries, and create a line graph by going to Insert > Chart menu.
It lets you create a line graph of different types, such as stacked line graph, 100% stacked line graph, lines with markers, stacked lines with markers, etc. You can then format the line chart as per your requirement. It lets you customize line graph style, line chart elements (axis title, data label, legend, etc.), labels, text and font, colors, title of chart, axes, etc. You can format properties like fill and line color, effects (soft edges, shadow, glow,3D format, 3D rotation, etc.), and size and properties too.
It supports four formats to export a line graph individually, namely, PNG, TIF, JPG, and BMP. Plus, it provides an option to copy graph and paste and use it in any other application.
Note: Its free version is ad-supported.
IBM Lotus Symphony
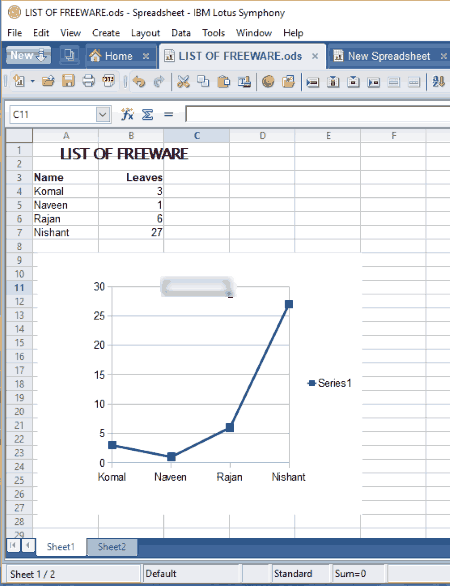
IBM Lotus Symphony is another alternative to a line graph maker software. It can be used to create a line graph plus a combination of column and line graphs. Like above software, this also follows similar procedure to create a line graph, which is as follows:
- Create or import a spreadsheet with several data entries.
- Select data entries and click Create > Chart option.
- Choose chart type as line graph (or “column and line”) and select a subtype (points only, lines and points, lines only, 3D lines). You can enable stack series and smooth lines.
- Now, customize data series, data range, and chart elements (titles, grid, and legend settings).
- You can format line properties, scale, positioning, labels, numbers, font, font effects, chart area, axis properties, chart wall, etc.
- To save line graph, it only lets you copy the graph to the clipboard. But, the spreadsheet with line graph can be saved as PDF, ODS, XLS, XLT, etc. files.
It is a decent line graph maker. The only disadvantage of this software is that it doesn’t let you export graph individually.
It can also be used for creating bar, column, pie, bubble, etc. charts.
Free Graph Maker
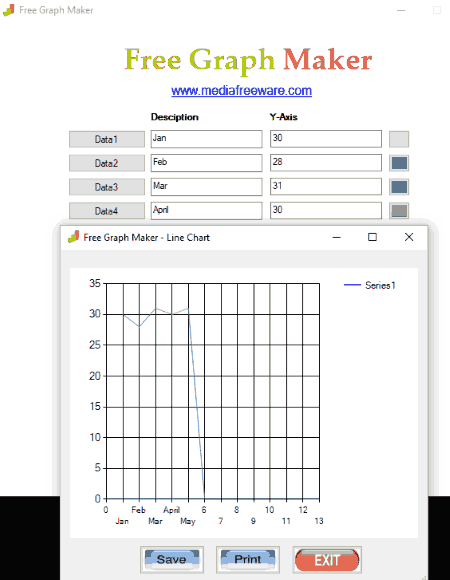
Free Graph Maker is a dedicated graph maker which let you create pie chart, area chart, pyramid chart, box plot chart, radar chart, etc. graphs. It also lets you create a line graph. For this, just add data entries with labels and respective values. It lets you add only up to 12 data entries for a particular line graph. The created line graph can be printed or save as JPG, BMP, and GIF images.
Graph Maker
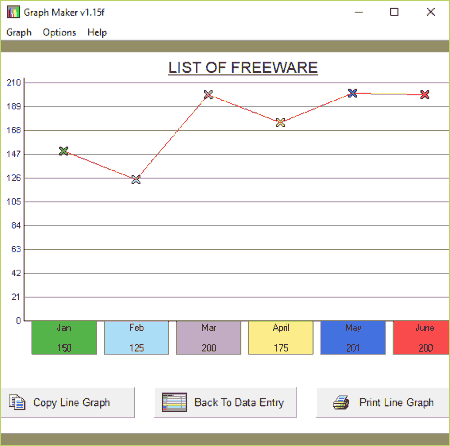
Graph Maker is another dedicated utility to create a line graph as well as pie chart and bar graph. You can add only one data series with up to 6 data entries. Just add dataset with description and values and click on Build a Line Graph button. You can customize title of graph and X and Y labels.
To save line graph, you only get a Copy option which you can use to copy line graph to the clipboard. Although, the graph can be directly printed. A file with data entries can be imported or exported as its own file format only.
SSuite Office
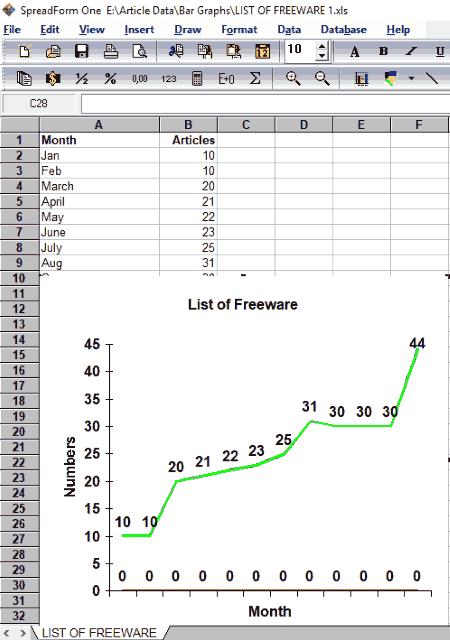
SSuite Office is yet another free office software which can be used as line graph maker. Its spreadsheet application named SpreadForm One can create a variety of graphs including line graphs, area charts, bar charts, combination graph, pie chart, surface graph, etc. For line graph, you can choose a subtype such as unmarked, marked, stacked, etc. It also lets you create a line graph in 2D and 3D. Apart from that, you can customize chart title, footnote, legend, axes, etc. By using combination graph option, you can create a column and line graph too.
This software doesn’t let you save the line graph individually. Although it provides a Copy As Image option, it didn’t work while my testing. You can print the spreadsheet or save it as XLS, VTS, etc. files.


About Us

We are the team behind some of the most popular tech blogs, like: I LoveFree Software and Windows 8 Freeware.
More About UsArchives
- May 2024
- April 2024
- March 2024
- February 2024
- January 2024
- December 2023
- November 2023
- October 2023
- September 2023
- August 2023
- July 2023
- June 2023
- May 2023
- April 2023
- March 2023
- February 2023
- January 2023
- December 2022
- November 2022
- October 2022
- September 2022
- August 2022
- July 2022
- June 2022
- May 2022
- April 2022
- March 2022
- February 2022
- January 2022
- December 2021
- November 2021
- October 2021
- September 2021
- August 2021
- July 2021
- June 2021
- May 2021
- April 2021
- March 2021
- February 2021
- January 2021
- December 2020
- November 2020
- October 2020
- September 2020
- August 2020
- July 2020
- June 2020
- May 2020
- April 2020
- March 2020
- February 2020
- January 2020
- December 2019
- November 2019
- October 2019
- September 2019
- August 2019
- July 2019
- June 2019
- May 2019
- April 2019
- March 2019
- February 2019
- January 2019
- December 2018
- November 2018
- October 2018
- September 2018
- August 2018
- July 2018
- June 2018
- May 2018
- April 2018
- March 2018
- February 2018
- January 2018
- December 2017
- November 2017
- October 2017
- September 2017
- August 2017
- July 2017
- June 2017
- May 2017
- April 2017
- March 2017
- February 2017
- January 2017
- December 2016
- November 2016
- October 2016
- September 2016
- August 2016
- July 2016
- June 2016
- May 2016
- April 2016
- March 2016
- February 2016
- January 2016
- December 2015
- November 2015
- October 2015
- September 2015
- August 2015
- July 2015
- June 2015
- May 2015
- April 2015
- March 2015
- February 2015
- January 2015
- December 2014
- November 2014
- October 2014
- September 2014
- August 2014
- July 2014
- June 2014
- May 2014
- April 2014
- March 2014
