4 Best Free SNMP Manager Software For Windows
Here is a list of Best Free SNMP Manager Software for Windows. SNMP stands for Simple Network Management Protocol which governs the management of connected IP devices within a computer network. Using any of these freeware, you can manage and monitor servers, computers, switches, virtual systems, printers, and other network devices within an enterprise. These SNMP monitoring software help you monitor connected devices within a network in terms of connectivity, availability, performance, bandwidth and traffic on servers, PCs, switches, etc., and more.
To configure devices, you need to enter a single or a range of IP addresses. Or, you can initiate an automatic scan for device discovery. Once added, you can assign different sensors i.e. monitoring topics for an individual device. MIB files can also be loaded in these SNMP manager software to have a watch over a particular object. You can add watch items called ping, trap, and variable.
The analysis data is shown in the form of a graph in real-time. You can customize update time interval to monitor this data. Also, the past analyzed data within a time range can be viewed. In some of these SNMP manager software, you can export the analyzed data as an HTML report.
Overall, these free SNMP manager for Windows are pretty easy to setup and use. But, if you have a tough time figuring any of them out, help center feature and demo videos are provided for you.
My Favorite SNMP Manager For Windows:
From the list, PRTG Network Monitor is my favorite SNMP manager software. In the free edition of this SNP monitoring software, you can add up to 100 sensors for devices being monitored. Live analysis data can easily be viewed, and the analysis report can be exported as an HTML, CSV, or XML file.
Spiceworks Network Monitor is another favorite of mine for SNMP monitoring. It is a straightforward SNMP manager using which you can monitor servers, devices, and switches.
You can also check out the list of best free Network IP Scanner, Hardware Monitor, and CPU Usage Monitor software for Windows.
PRTG Network Monitor
PRTG Network Monitor is an advanced SNMP manager software for Windows. Although it’s a 30-day trial version and for first 30 days, you have no restrictions on using all of its features. But after that, you can use it for free for 100 sensors (monitoring topics) only. PRTG Network Monitor works in your default web browser.
Configurations:
Firstly, using PRTG Administrative Tool, you can configure settings like web server (HTTP port number, IP address for PRTG web server, etc.), probe settings (name of probe, reconnect time, etc.), etc. In Administrator tab, you can set up your login name and password to use this software. These login credentials are required every time your restart this free SNMP monitoring software. You can change username and password whenever you want. Other personalization options include system language (English, German, Spanish, French, Portuguese, Dutch, etc.), restart options, etc.
As you open PRTG Network Monitor, you need to setup devices by going to Devices menu. There, you can add core servers, clients, virtual systems, printers, etc. using the respective domain name or IP address. A group of devices can also be added to it. You can also run Auto Network Discovery to add devices within a specified IP range. This may take some time.
Adding Sensors:
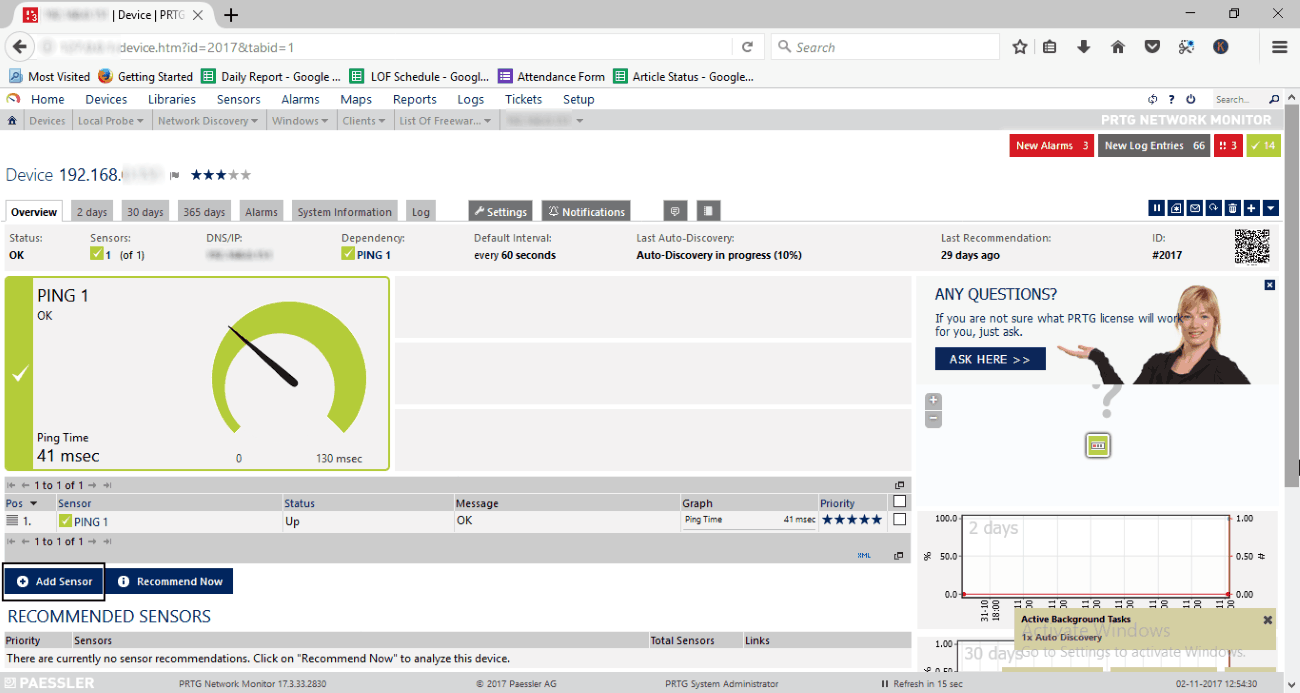
To monitor a device, you need to select the device and add sensors. On clicking Add Sensors button, it shows categories of sensors which you can add. Select what you want to monitor (bandwidth, uptime, speed, performance, network infrastructure, etc.), target system type (Windows, File Server, Cloud Service, Database, Email Server, etc.), and technology used (SNMP, Ping, HTTP, SSH, etc.). As you select categories, it displays all available sensors. Some of the sensor types are monitor DNS server, connectivity, bandwidth and traffic on servers, PCs, switches, etc., web server using HTTP, FTP server, Google Drive, SMTP, etc. These are just a few popular ones. It provides a wide range of sensors to monitor a network. As mentioned above, you can choose up to 100 sensors in free edition.
Analysis:
For the analysis purpose, it shows information related to a particular monitoring element (sensor), like uptime, downtime, sensor type, dependency, coverage, last scan, last up, last down, interval, etc. Apart from this, it displays sensor specific data. For example, for PING, it displays packet loss, Ping time, minimum value, maximum value, etc. You can monitor Live Data as well as view statistics from past 2 days, 30 days, or 365 days. From the Historic Data tab, you can export statistics report related to a specific monitoring topic in CSV, HTML, and XML formats. For this, you can select a time span. In the report, you get information in graphical and tabular forms. Using the Alarms menu, you can view sensors with errors, warnings, and unusual status. From the Setup > System Administrator section, you can customize scanning interval, uptime threshold, etc.
PRTG Network Monitor is one of the best SNMP monitoring software for Windows. It shows the live report in graphical and tabular forms, which makes it easy to interpret received data and analyze it. For convenience, you can enable email notifications for particular events for a sensor. It has numerous other great features which include creating a personalized dashboard, making a particular page as the homepage for PRTG Network Monitor, using Tickets to manage issues raised while monitoring, etc. In case of any difficulty, you can always use its Help Center or visit its official website.
Spiceworks Network Monitor
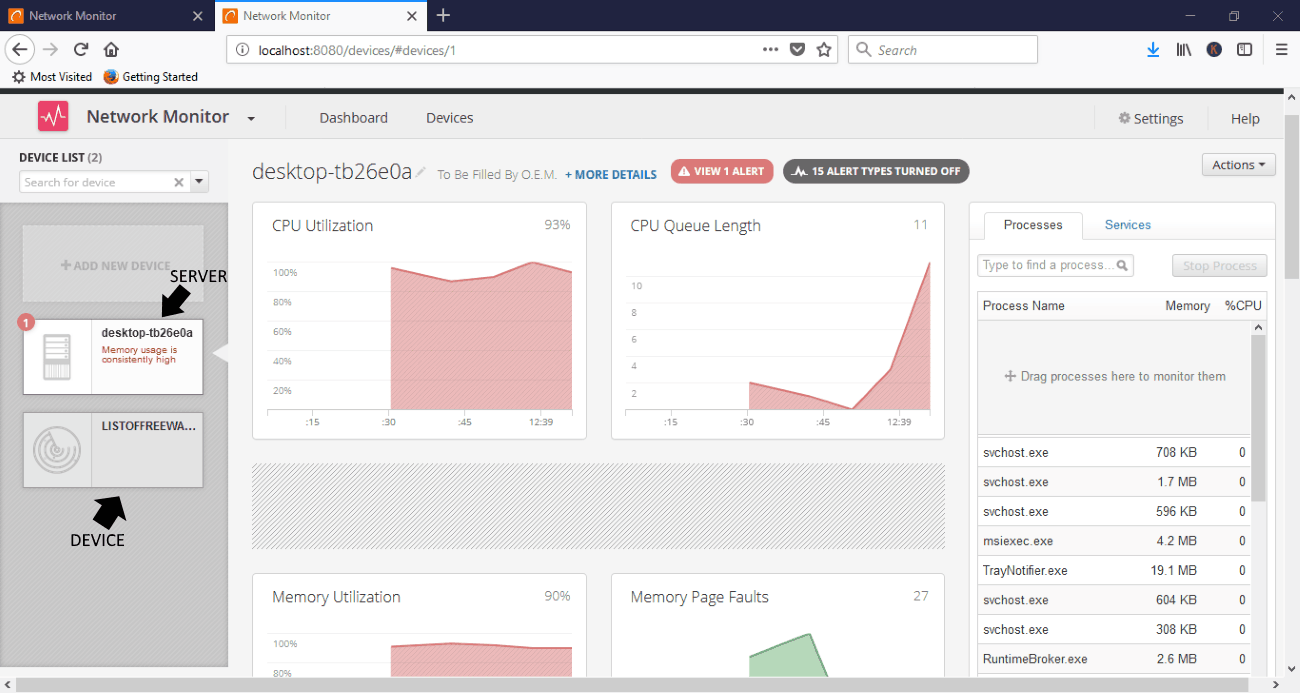
Spiceworks Network Monitor is a free SNMP manager for Windows. It is another good software to monitor networking devices and get real-time status and alerts regarding the same. It operates in a web browser. On the Dashboard, you can view the number of servers, switches, and sensors which are currently being monitored.
Let’s talk about its main modules and functionalities. The main screen is divided into three sections which are used to add servers, devices, and switches. You can add a Windows server using IP address or hostname, device name, username (domain name), and password. As you do that, in the Server Watchlist, you will be able to see real-time data including CPU usage (in percentage), Disk rate (KB/s), Network rate, and Memory usage. Click on the added server name and you will see a detailed report in the form of a graph. The statistics are shown in individual graphs for CPU Utilization, CPU Queue Length, Memory Utilization, Memory Page Faults, Disk Used Space, Disk I/O, Network I/O, Network Packets, and Network Packet Loss. The running processes (with memory and % CPU usage) and services (with state) can be accessed from the right panel. On hovering mouse over a process, it shows the process ID, name, and user; while for services, it shows name and description. For your convenience, it lets you drag a process and services to monitor. It provides a Stop Process button too, but it didn’t work fine during my testing.
To add devices, go to Online Watchlist and click on Add Device. Now, enter IP/Hostname, Username (optional), and select check type (Ping, HTTP, HTTPS, SSH, SIP). In advanced settings, you can customize settings including timeout (ms) and poll frequency (30s, 5m, 15m). The device will be added and you will be able to monitor its Network Latency graph on clicking the device name. In this Online Watchlist section, you can view all added devices with their statuses (online or offline).
In the Networking Watchlist, you can add a switch with IP/Hostname and SNMP Community string. This list monitors packets per sec, packet loss, I/O rate, etc.
You can enable alerts for particular condition like CPU is spiking, network bandwidth is spiking, disk is overloaded, etc. The alerts are displayed on the dashboard. This will help you manage devices according to the alert generated. An Actions option is provided to let you customize alert settings (dashboard alerts and email alerts) and credentials used to connect a device.
Overall, Spiceworks Network Monitor is quite user-friendly. It is another one of the best SNP monitoring software. Details about a monitoring device like Manufacturer, Processor, RAM, Disk Capacity, Last Reboot, etc. can also be viewed in it.
LoriotPro

LoriotPro is another free SNMP monitoring software for Windows. To use its free version, launch LoriotPro and select Use Free Edition from the available licenses. If you wish, you can evaluate its paid versions for 30 days. Of course, the free edition has some limitation like Service plugin, Directory Plugin, etc. are not supported in it.
To start with, it offers a Demo module which helps you understand how LoriotPro works. So before you start using it, you can learn its functionalities properly. You can also checkout its demonstration videos on YouTube here > LoriotPro Demo Videos.
It discovers devices within your network by automatically scanning them. The manual discovering option is also provided in it. You can customize Discovery settings from Configure menu > Discover Process option. You can select a number of router hops to discover, set and use IP address range, set discover process running interval, discover from a remote host, assign parameters to discover hosts (polling, DNS name, etc.), etc. It provides a tree-like view for managed devices in the left panel. On clicking a device, you can edit host properties like DNS name resolution, polling parameters, icon, discover options, etc.
On the main interface, you can view agents, their respective IP addresses, MAC address, last response, etc. information. The live response time can be viewed on clicking an agent. It is represented in the form of a graph in a new window. Also, a detailed parameter list can be seen in the same window, which includes trap received, last IP scan, IP expert, incoming packets, outgoing packets, OEM status, etc. Thread Monitor is also provided with thread information like ID, module, start, status, clock, UID, etc.
The bottom panel contains events (time stamp, IP reference, alerts, etc.), Syslog (time stamp, facility, level, alert, etc.), and traps (object identifier, IP source, UID, etc.) information. You can also add custom events here. A health toolbar below shows statuses of aforementioned attributes.
In the MIB menu, you can find various tools like SNMP Walker, Create Report from MIB files, etc. In the same menu, there is a MIB Compiler tool which lets you browse, scan, and compile MIB files. MIB tree is also provided to easily access particular objects within a network database.
Tools like Ping, Telnet, Execute External Program, Event Simulator, etc. can be accessed from its Tool menu. Dashboard Player, MiniMap, Event Browser, Task View, etc. windows make the monitoring task rather simple and easy-going.
Overall, LoriotPro is a nice SNMP manager for Windows.
PowerSNMP Free Manager
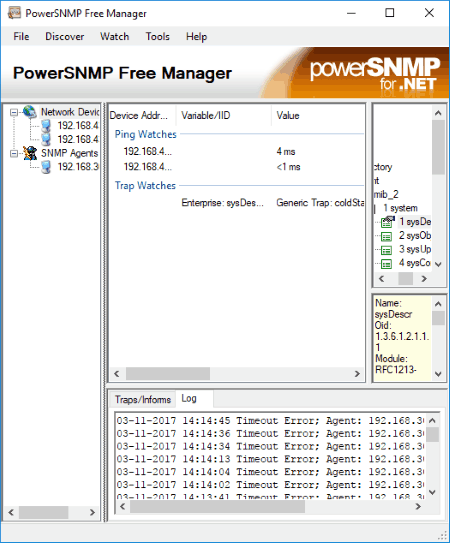
PowerSNMP Free Manager is a basic SNMP manager software for Windows. You can add network devices and SNMP agents by going to Discover menu. You can discover devices within a network using a range of IP address, broadcast IP address, or manually add an individual IP address. For an SNMP agent, you need to enter details of the device which include IP address, port number, SNMP version, and community. It will then monitor the values of added SNMP Agent variables, monitor traps, and pings network hosts.
On its main interface, you can find discover device (added devices), watch item (added watch items), and MIB (loaded MIB file) windows. In the MIB window, you can see objects in the hierarchal form. On clicking an object, information like OID, status, access, type, module, etc. are shown. In a below panel, you can see traps and log information.
PowerSNMP Free Manager lets you add three types of watch on an agent named Variable Watch (variable ID and value), Trap Watch (generic trap, specific trap, etc.), and Ping Watch (response time). You can add these watch items by going to Watch menu, or drag and drop respective MIB file from right panel to Watch Item window.
You can configure the update interval time (seconds) and timeout (ms) for individual SNMP Agent. It lets you enable email notification alerts if you want.
PowerSNMP Free Manager is a basic SNMP monitoring software with a straightforward user interface.


About Us

We are the team behind some of the most popular tech blogs, like: I LoveFree Software and Windows 8 Freeware.
More About UsArchives
- May 2024
- April 2024
- March 2024
- February 2024
- January 2024
- December 2023
- November 2023
- October 2023
- September 2023
- August 2023
- July 2023
- June 2023
- May 2023
- April 2023
- March 2023
- February 2023
- January 2023
- December 2022
- November 2022
- October 2022
- September 2022
- August 2022
- July 2022
- June 2022
- May 2022
- April 2022
- March 2022
- February 2022
- January 2022
- December 2021
- November 2021
- October 2021
- September 2021
- August 2021
- July 2021
- June 2021
- May 2021
- April 2021
- March 2021
- February 2021
- January 2021
- December 2020
- November 2020
- October 2020
- September 2020
- August 2020
- July 2020
- June 2020
- May 2020
- April 2020
- March 2020
- February 2020
- January 2020
- December 2019
- November 2019
- October 2019
- September 2019
- August 2019
- July 2019
- June 2019
- May 2019
- April 2019
- March 2019
- February 2019
- January 2019
- December 2018
- November 2018
- October 2018
- September 2018
- August 2018
- July 2018
- June 2018
- May 2018
- April 2018
- March 2018
- February 2018
- January 2018
- December 2017
- November 2017
- October 2017
- September 2017
- August 2017
- July 2017
- June 2017
- May 2017
- April 2017
- March 2017
- February 2017
- January 2017
- December 2016
- November 2016
- October 2016
- September 2016
- August 2016
- July 2016
- June 2016
- May 2016
- April 2016
- March 2016
- February 2016
- January 2016
- December 2015
- November 2015
- October 2015
- September 2015
- August 2015
- July 2015
- June 2015
- May 2015
- April 2015
- March 2015
- February 2015
- January 2015
- December 2014
- November 2014
- October 2014
- September 2014
- August 2014
- July 2014
- June 2014
- May 2014
- April 2014
- March 2014
