10 Best Free Coronavirus Dashboard Websites
Here is a list of best free coronavirus dashboard websites. As you know, the coronavirus or COVID-19 cases are rapidly growing all over the world. To track its growth and view all current statistics and data in one place, you can use these coronavirus dashboard websites. These websites provide you the latest and accurate statistics of this pandemic. Using them, you can easily track the number of confirmed cases, recovered cases, and deaths in all the affected countries. In addition to that, these websites offer graphs to visualize the growth or reduction of different statistics of this pandemic. The interactive world map is another important aspect that all these websites offer. Through an interactive world map, you can quickly find out all the most affected countries in the world. You can also find out the current cases, recovery rate, deaths, and other statistics of any country using maps.
In some of these coronavirus dashboard websites, you can also compare statistics of different countries with one another. Apart from statistics, some websites also give you essential information to prevent yourself from coronavirus. Plus, links of other credible news and coronavirus tracking websites are also offered by some coronavirus dashboards. Overall, you can use any one of these websites to get the latest statistics about COVID-19 pandemic. Go through the list to know more about these websites.
My Favorite Coronavirus Dashboard Website:
Coronavirus Dashboard is my favorite website because it gives you all the necessary coronavirus information in one place. Plus, various graphs, maps, and lists to visualize the growth and effect of this disease are present in it.
CoronaTab is another good coronavirus dashboard that you can try as it also offers all the latest statistics, graphs, and maps. In addition to statistics, it also provides important preventive measures along with links of trusted websites to know more about this pandemic.
You can also check out lists of best free Coronavirus Data Analyzer, Coronavirus Reminder Tools, Coronavirus Monitoring Tools, and Coronavirus Map software for Windows.
Coronavirus Dashboard
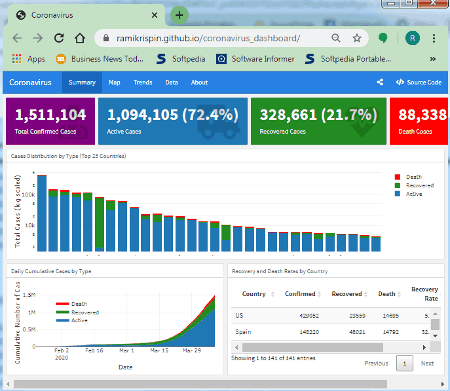
Coronavirus Dashboard is a free open source coronavirus dashboard website to get the latest statistics and other associated information about the coronavirus pandemic. In this website, you can find maps, statistics, trends, and various associated data to give you comprehensive COVID-19 information. Let’s take a brief look at the main features of this website.
Main Features:
- Summary: In this section, you can find the latest number of coronavirus affected people (confirmed cases, active cases, recovered cases, and deaths) all over the world. It also provides a bar graph along with a line graph highlighting the number of affected people in the top 25 most affected countries. In addition to that, a list of all affected countries with their number of cases, deaths, recovered people, recovery rate, and death rate is also present.
- Map: As its name suggests, it provides an interactive world map highlighting the coronavirus affected countries. All the coronavirus affected countries over the map are covered with three colors namely Orange (to show the number of affected people), Red (to show the number of deaths), and Green (to highlight the number of recovered people).
- Trends: It gives you the latest coronavirus trends in the form of trajectory graph (to show cumulative positive cases), bar graph (to shows number of cases), and bubble graph (to shows recovery rate).
Final Thoughts:
It is a comprehensive coronavirus dashboard website that offers a lot of data, statistics, graphs, and maps to track this pandemic.
CoronaTab
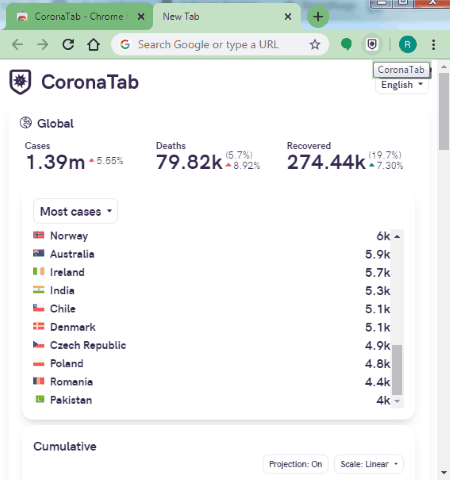
CoronaTab is a coronavirus dashboard extension for the Chrome browser. This extension adds many coronavirus statistics, graphs, interactive, maps, along with important health precaution information to the new tab of the Chrome browser. Whenever you open a new tab, you can view the dashboard of this extension. Now, let us checkout main functionalities of this coronavirus dashboard.
Main Features:
- Cumulative Graph: This graph shows the growth of detected cases, death, and recovered people of all over the world.
- Daily Graph: It shows a bar graph highlighting the growth of detected cases, death, and recovery of the last seven days by default. It also gives you the option to view the daily bar graph highlights of the last 21 days.
- Heat Map: It shows an interactive world map highlighting all the COVID-19 hotspots of the world. By clicking on a hotspot, you can view its total number of cases, recovered people, deaths, recovery percentage, and recovery rate.
- Affected Countries List: It shows a list of all countries that you can easily sort from highest to lowest order according to the number of cases, highest death rate, lowest death rate, highest recovery rate, etc.
- Statistics by country and cities: In this extension, you can also select any city of a country to track the cases of that city. Plus, it also generates cumulative and daily graphs for the selected city.
- World Overview: An overview highlighting the total number of cases, deaths, and recovered people of the word is also offered by it.
Additional Features:
- General Advice: In it, you can find all the verified general advice that you should take to prevent coronavirus like washing your hands, minimize personal contact, don’t touch your face, etc.
- Quick Links: It offers quick links to many verified websites to track this pandemic and get more information about this pandemic.
Final Thoughts:
It is one of the most informative coronavirus dashboards in which you can view the latest coronavirus statistics, graphs, heatmaps, and information about preventive measures.
COVID-19 - CoronaVirus
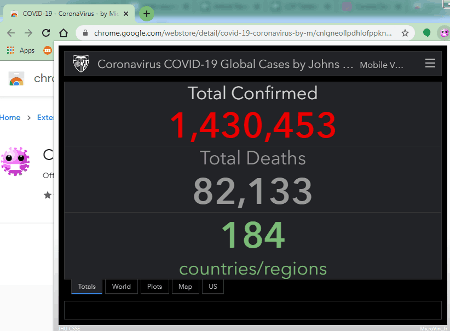
COVID-19 – CoronaVirus is a free coronavirus dashboard extension for the Chrome browser. This extension offers a dashboard that helps you track the number of infected people, number of recovered people, number of deaths, coronavirus hotspots all over the world, the rapid increase of coronavirus, and other important statistics.
Main Features:
- Totals: This section of the dashboard gives an overview of the current pandemic such as the number of all detected COVID-19 cases, deaths, affected countries, etc.
- Map: It offers an interactive world map highlighting all the coronavirus hotspots of the world.
- Plots: It is another handy feature that shows you the rapid growth of coronavirus all over the world in the form of the bar and dot plot graphs.
- World Lits: It shows a country-wise list highlighting the number of COVID-19 cases in each country.
- US: It provides a list to show the total number of COVID-19 cases in each state of the United States.
Final Thoughts:
This coronavirus dashboard extension provides all the necessary data to track new and existing cases of the coronavirus of all over the world.
coronavirus.davidb.dev
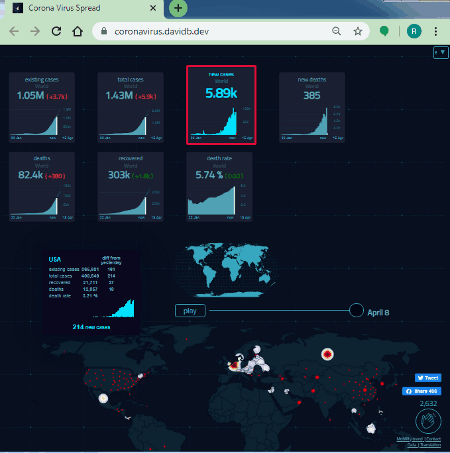
coronavirus.davidb.dev is another simple coronavirus dashboard website. Through this website, you can easily track this pandemic from its initial days to the current day. On its interface, it shows a slideshow of various coronavirus statistics of different dates.
Main Feature:
- Slideshow Statistics: On its interface, you can view eight different statistics of different dates namely total number of existing cases, total cases, new cases, new deaths, deaths, recovered people, and death rate.
- Associated Graphs: With each value of the slideshow, you also get a graph showing the growth of that statistical vale.
- World Map: The world map present on this website shows all the coronavirus hotspots of the world.
- List: A list of all affected countries along with their rank (according to the number of coronavirus cases) is also present on it.
Additional Features:
- Play: It lets you play animation depicting increase in coronavirus statistics over time.
- Language: You can view coronavirus dashboard in multiple languages other than English, such as French, German, Polish, etc.
Final Thoughts:
It is one of the simplest coronavirus dashboard website to view the growth of coronavirus affected people over time.
coronavirus-map
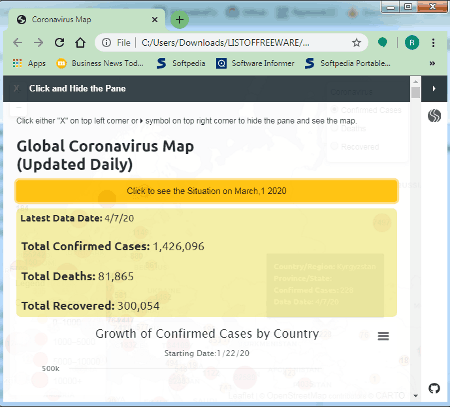
coronavirus-map is a free open source coronavirus dashboard website through which you can track country-wise coronavirus cases and exponential growth of coronavirus over time. It also offers a three-layer interactive world map to highlight the number of confirmed cases, recovered cases, and deaths all over the world. In addition to that, you can find multiple graphs and statistics that provide further provide about this pandemic. Keep on reading to know main features of this coronavirus dashboard.
Main Features:
- Interactive Map: Over the interactive world map of this website, you can view many circles with numbers over different countries to show their confirmed cases, confirmed deaths, and number of recovered people. By default, this map only highlights the number of confirmed cases. To view recovered people of each country and deaths over the interactive map, select the Deaths and Recovered bullet buttons.
- Graphs: This website offers three graphs through which you can track the growth of confirmed cases by country, growth of deaths by country over time, and growth of recovered people by country over time.
- Coronavirus Statistics: A good set of statistics related to COVID-19 is also provided by it such as countries with the highest daily percentage change in deaths, top countries with the highest daily increase in number of deaths, countries that most recently announced the first deaths within their borders, and more.
Additional Feature:
- Save Graphs: This website lets you save generated graphs in PNG, JPG, PDF, and SVG formats.
Final Thoughts:
This coronavirus dashboard website offers comprehensive graphs and statistics associated with COVID-19 through which you can track new cases and also analyze the growth of this pandemic.
COVID-19 Dashboard
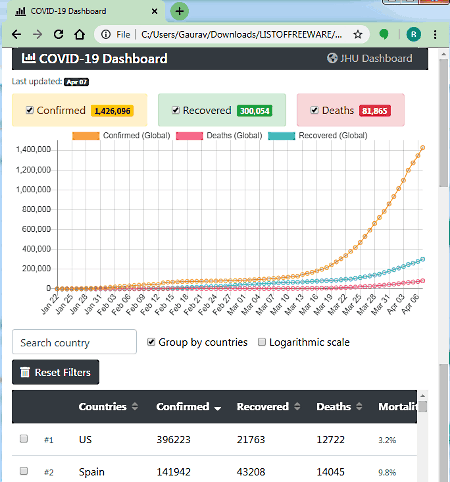
COVID-19 Dashboard is another good coronavirus dashboard website. It is a simple and cleanly designed website through which you can view the latest statistics about coronavirus affected countries and people. Plus, a graph to show the growth of COVID-19 over time is also present in it. Now, check out the main features of this website.
Main Features:
- Last Updated: It shows the latest number of confirmed COVID-19 patients, recovered patients, and deaths occurred around the world.
- Graph: This website offers a linear graph that highlights confirmed cases, recovered cases, and deaths over the timeline of this pandemic.
- List Of Countries: A list of all countries affected by coronavirus is also present on its interface that you can sort according to the number of confirmed cases, recovered cases, deaths, and mortality rate. An option to search a country by its name is also available.
Final Thoughts:
It is one of the simplest coronavirus dashboard websites in which you can view the latest statistics about the coronavirus pandemic.
CORONA STATISTICS
CORONA STATISTICS is yet another free coronavirus dashboard website to view important statistics about coronavirus pandemic. To show statistics, this website uses lists, maps, and graphs. Now, check out the main features of this coronavirus dashboard.
Main Features:
- Latest Global Statistics: It shows the lastest number of affected people, deaths, recoveries, and people in a critical position all over the world.
- Today’s Statistics of Affected Countries: It shows the current day statistics of all the affected countries.
- Interactive Map: It offers a four-layered interactive world map over which you can view hotspots highlighting the number of cases, deaths, recovered people, and people in a critical position.
- Rate Distribution: It helps you visually compare the number of active cases, recovered people cases, death cases, and critical cases with each other.
- Infection History Graph: It is another handy graph that lets you visually track the growth of detected, recovered, and death cases over time due to coronavirus.
- Infection Distribution By Countries: It shows a pie chart highlighting the percentage of most affected countries like Spain, USA, Italy, Germany, etc.
Final Thoughts:
It is a visually pleasing coronavirus dashboard that helps you track and understand various statistics about this pandemic.
Covid-19 Global
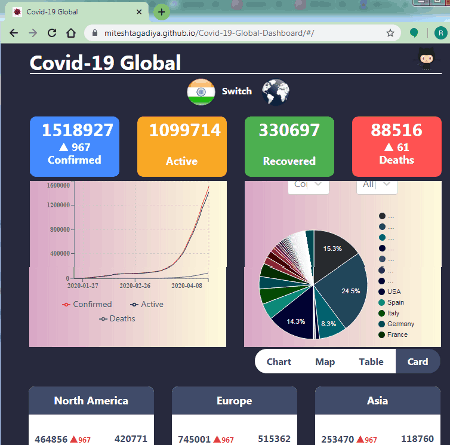
Covid-19 Global is another free open source coronavirus dashboard website. On this website, you get two modes namely Global Dashboard and India. Through the global dashboard, you can track important coronavirus statistics of all countries. On the other hand, the India mode shows coronavirus statistics of all the states of India.
Main Features:
- Primary Statistics: On the top of each mode, you can find primary statists namely number of confirmed deaths, number of recovered people, number of confirmed cases, and number of active cases.
- Charts: To show the growth of deaths, confirmed cases, and active cases over time, this dashboard offer a line chart. Similarly, to show the percentage of deaths, active cases, and recovered cases between different countries or states, this dashboard offers a pie chart. In addition to that, individual charts to highlight main coronavirus statistics of all countries and states (in case of the India dashboard mode) are also available.
- Map: This section shows a world map highlighting the countries affected by this pandemic.
- Table: It shows a table containing all the countries with their coronavirus statistics.
Final Thoughts:
It is another feature-rich coronavirus dashboard website to track coronavirus statistics of different countries and various states of India.
Corona Dashboard
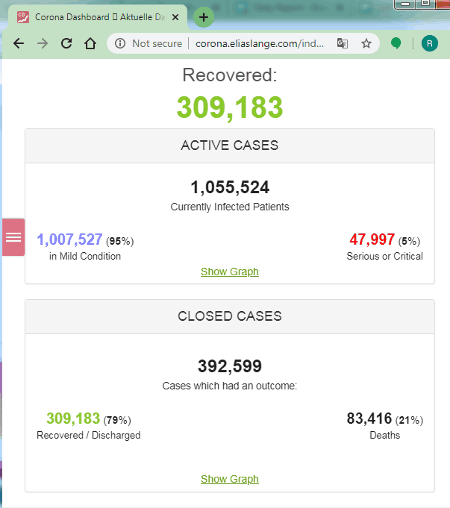
Corona Dashboard is the next free coronavirus dashboard website. This website combines various websites and online apps to give you the latest coronavirus statistics along with important news associated with COVID-19.
Main Features:
- CovApp: It is an online app that contains a set of questions that users can answer to determine whether they have coronavirus or not. It also gives you doctor recommendations and contact info, if needed.
- Corona Virus app: It shows a world map with red circles to highlight coronavirus affected countries of the world along with their current number of confirmed cases, deaths, recovered people, etc.
- Robert Koch Institute: In it, you get various graphs, maps, and list of countries to give you the latest coronavirus statistics.
This coronavirus dashboard includes many other websites (Worldometer, Corona Meter, and Country Charts) as its modules that offer a similar set of data.
Final Thoughts:
It is another good dashboard that you can try it you want the most accurate and latest coronavirus statistics.
Coronavirus Country Comparator
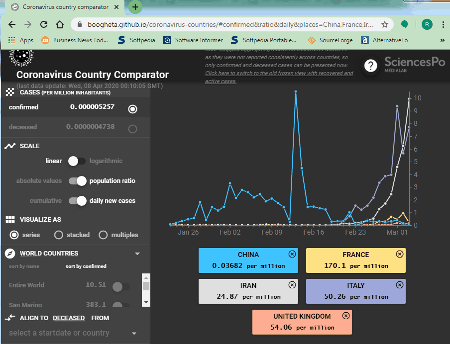
Coronavirus Country Comparator is one more free coronavirus dashboard website. As its name implies, it is mainly used to compare coronavirus statistics of different countries with each other. To do that, it offers a line graph to compare statistics of up to 8 countries at a time.
Main Feature:
- Cases Comparision: In this website, you can primarily compare the number of confirmed cases and the number of deaths between multiple countries using a line graph.
Additional Features:
- Scale: During the comparison, you can change the graph scale from linear to logarithmic, population ratio to absolute values, and cumulative to daily new cases.
- Visualize As: Using it, you can change the graph format from the line graph to stacked or multiple graph type.
- World Countries: Using it, you can select multiple countries that you want to compare. In addition to that, it also shows the total number of detected cases in all countries.
Final Thoughts:
It is a good website to compare the confirmed cases and death between multiple countries but it lacks many important statistics that you get in other coronavirus dashboard websites.


Naveen Kushwaha
Passionate about tech and science, always look for new tech solutions that can help me and others.
About Us

We are the team behind some of the most popular tech blogs, like: I LoveFree Software and Windows 8 Freeware.
More About UsArchives
- May 2024
- April 2024
- March 2024
- February 2024
- January 2024
- December 2023
- November 2023
- October 2023
- September 2023
- August 2023
- July 2023
- June 2023
- May 2023
- April 2023
- March 2023
- February 2023
- January 2023
- December 2022
- November 2022
- October 2022
- September 2022
- August 2022
- July 2022
- June 2022
- May 2022
- April 2022
- March 2022
- February 2022
- January 2022
- December 2021
- November 2021
- October 2021
- September 2021
- August 2021
- July 2021
- June 2021
- May 2021
- April 2021
- March 2021
- February 2021
- January 2021
- December 2020
- November 2020
- October 2020
- September 2020
- August 2020
- July 2020
- June 2020
- May 2020
- April 2020
- March 2020
- February 2020
- January 2020
- December 2019
- November 2019
- October 2019
- September 2019
- August 2019
- July 2019
- June 2019
- May 2019
- April 2019
- March 2019
- February 2019
- January 2019
- December 2018
- November 2018
- October 2018
- September 2018
- August 2018
- July 2018
- June 2018
- May 2018
- April 2018
- March 2018
- February 2018
- January 2018
- December 2017
- November 2017
- October 2017
- September 2017
- August 2017
- July 2017
- June 2017
- May 2017
- April 2017
- March 2017
- February 2017
- January 2017
- December 2016
- November 2016
- October 2016
- September 2016
- August 2016
- July 2016
- June 2016
- May 2016
- April 2016
- March 2016
- February 2016
- January 2016
- December 2015
- November 2015
- October 2015
- September 2015
- August 2015
- July 2015
- June 2015
- May 2015
- April 2015
- March 2015
- February 2015
- January 2015
- December 2014
- November 2014
- October 2014
- September 2014
- August 2014
- July 2014
- June 2014
- May 2014
- April 2014
- March 2014
