7 Best Free Coronavirus Data Analyzer Software For Windows
Here is a list of best free coronavirus data analyzer software for Windows. Through these software, you can visualize various coronavirus statistics in the form of graphs. The corresponding graphs generated through these software can easily be analyzed to draw the correct conclusion. Plus, graphs also simplify the process to track the growth of this pandemic all over the world. To generate graphs, these software use statistics like number of coronavirus cases, recovered people, deaths, etc. Most software automatically fetch necessary data from the internet in real time to generate graphs. However, in some software, you need to manually provide the latest data to generate graphs for the analysis.
Most of these coronavirus data analyzer software use linear and logarithmic line or dot plot charts to represent the available data. You can also switch between different types of graphs. Plus, options to save graphs in the form of PNG, JPG, BMP, GIF, etc., are also offered by some. Apart from graphs, you also get an interactive world map in some software to view all the affected countries over a virtual world map. In addition to that, you also find country wise data of effected people, recovered people, and deaths in these software that you can analyze. In general, all of these software are useful to visualize coronavirus data on graphs and analyze its trend all over the world. Go through the list to know more about these software.
My Favorite Coronavirus Data Analyzer Software For Windows:
coronavirus-map is my favorite software because it offers the most detailed graphs to analyze different aspects of coronavirus pandemic over time. Plus, it also covers the data from various countries. It also provides a multi-layered and interactive world map to highlight the hotspots of this pandemic.
CoronaTab is a good coronavirus data analyzer extension for Chrome through which you can analyze coronavirus data.
You can also check out lists of best free Coronavirus Reminder, Coronavirus Map, and Coronavirus Monitoring Tools software for Windows.
coronavirus-map
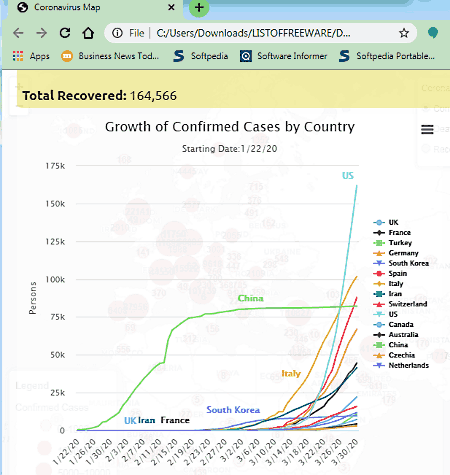
coronavirus-map is a free open source coronavirus data analyzer software for Windows. It is a web-based software that needs a web browser to launch its interface and an active internet connection to update the data.
In this software, you get multiple coronavirus statistics graphs that help you analyze the growth of confirmed cases by country, growth of deaths by country, and growth of recovered people by country. Apart from graphs, it offers a multi-layered world map highlighting coronavirus hotspots of the world. Now, check out the main features of this software.
Main Features:
- Growth of Confirmed Cases By Country Graph: Through this graph, you can track and analyze the rapid growth of coronavirus cases in different countries (UK, US, Germany, Italy, Canada, Australia, and more) over time.
- Growth of Death By Country Graph: In this graph, you can view the number of deaths on different dates in different countries.
- Growth of Recovered By Country Graph: This graph helps you view and analyze the growth of recovered people in different countries at different dates.
- Coronavirus Statistics: This software also provides many statistics related to this pandemic that you can analyze, such as top countries with the highest daily increase in number of deaths, countries with the highest daily percentage change in deaths, countries that most recently announced the first deaths within their borders, and more.
All the graphs present in this software can easily be saved in PNG, JPG, SVG, and PDF formats.
Additional Features:
- Interactive Coronavirus Map: Using the interactive map, you can easily select any country to find out its coronavirus cases, deaths, and number of recovered people. Plus, it helps you visualize the spread of coronavirus cases in the world.
Final Thoughts:
It is one of the best coronavirus data analyzer graph software because it offers detailed graphs and various statistics that help you analyze various aspects of coronavirus pandemic.
CoronaTab
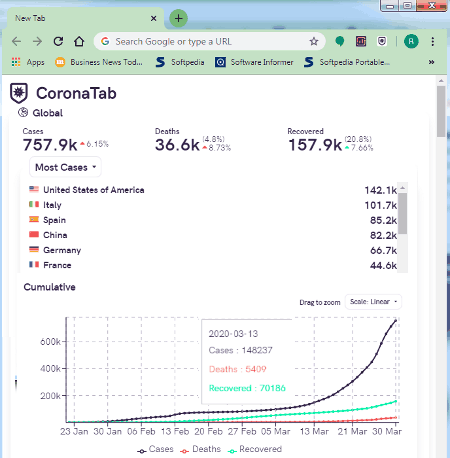
CoronaTab is another free coronavirus data analyzer extension for Chrome. As its name suggests, it shows various graphs and statistics related to coronavirus cases in the new tab of Chrome. This extension also shows correct measures to fight coronavirus, along with many verified links to get correct information about Covid-19. Now, let’s have a look at the main features of this software.
Main Features:
- Cumulative Graph: This graph shows the growth of detected cases, death, and recovered people of all over the world. By default, this graph shows linear growth values that you can change to logarithmic values using the Scale menu.
- Daily Graph: It shows a bar graph highlighting the growth of detected cases, death, and recovery of the last seven days.
Additional Features:
- This software also shows the country-wise statistics of the number of infected people.
- A heatmap to highlight all the affected countries over a world map is also available.
- It also provides a good set of general advice to fight coronavirus and verified links of multiple coronavirus news and tracking websites.
Final Thoughts:
It is a feature-rich coronavirus data analyzer extension that offers a good set of graphs and information about this pandemic that you can analyze.
CoronaVirusTracker
CoronaVirusTracker is another free open source coronavirus data analyzer software for Windows. To run this software, you need a web browser. Plus, an active internet connection to update the information is also needed.
It is a simple software that shows a bar graph highlighting the number of unresolved reported cases, reported recoveries, and reported deaths. All three graph parameters (detected cases, deaths, and recovered people) is highlighted in different colors. A handy choose another date feature to view and analyze the graph of previous dates is also available. Let’s take a brief look at the main features of this software.
Main Features:
- Coronavirus Bar Graph: It is the main feature of this software through which you can view and analyze the number of currently infected people (highlighted in blue color), recovered people (highlighted in green color), and deaths (highlighted in red color). Some of the countries that this graph include are US, Chine, Italy, Spain, Germany, France, and Iran.
- Date Filter: It is another important feature through which you can switch between the graphs of different dates.
Additional Feature:
- Exclude China: As its name suggests, it lets you remove or exclude the graph of China from the list of graphs.
Final Thoughts:
It is a simple and effective coronavirus data analyzer software in which you can view and analyze bar graph highlighting the number of affected people, recovered people, and deaths of different countries.
COVID-19 – CoronaVirus
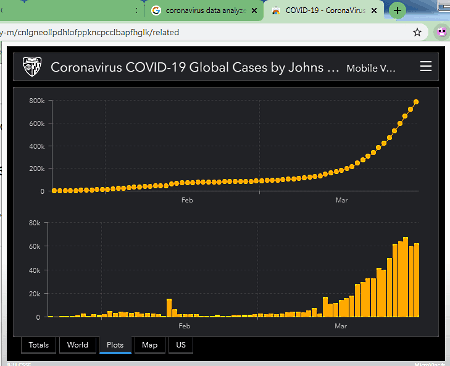
COVID-19 – CoronaVirus is a free coronavirus data analyzer extension for Chrome. It is a Chrome extension that shows bar and dot plot graphs showing the rapid growth of coronavirus cases in the world. In addition to that, it shows statistics and world map about coronavirus affected countries. Now, check out the main features of this software.
Main Features:
- Plot: It is the main graph section of this extension in which you can view and analyze dot plot and bar graphs showing the growth of coronavius cases all over the world. These graphs also help you track the growth of this pandemic over time.
- Map: In this section, you get a world map highlighting all the coronavirus affected countries with red circles.
Additional Features:
- Totals: It gives an overview of the total number of coronavirus cases all over the world, total number of deaths, and the total number of affected countries.
- US: It only shows the number of coronavirus cases of different states of the United States.
Final Thoughts:
It is a simple and easy to use coronavirus data analyzer extension for Chrome through which you can analyze coronavirus growth graphs.
COVID-19 Chart Tool
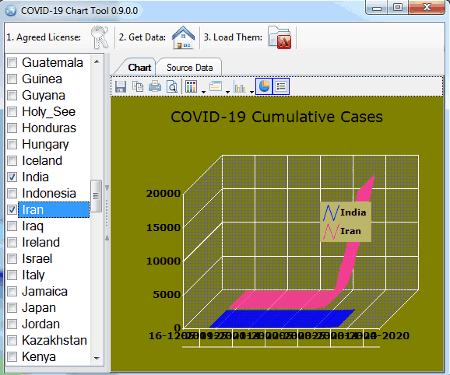
COVID-19 Chart Tool is the next free coronavirus data analyzer software for Windows. This software shows coronavirus growth data in the form of various graphs (Line, Spline, Gantt, Pie, Radar, Kagi, etc.) that you can analyze. Plus, it also lets you compare the coronavirus growth graphs between different countries. However, unlike other similar software, you need to manually download and load the latest geographic distribution of COVID-19 data in this software. Now, check out the main features of this software.
Main Features:
- Chart: It is the primary section of this software that converts the loaded coronavirus growth data into graphs that you can analyze. To change the graph type, you can use its Change type menu. It also offers a 3D option to display graphs in three-dimensional format. After viewing and analyzing the graphs, you can save it in PNG, BMP, JPG, TIFF, etc., formats.
- Country Panel: Through this panel, you can select two or more countries to view and compare their graphs.
- Source Panel: In it, you can view the loaded coronavirus source data that carries country-wise data of coronavirus cases.
Final Thoughts:
It is another easy to use coronavirus data analyzer software that helps you visualize, compare, and analyze the data of various countries.
covid-19
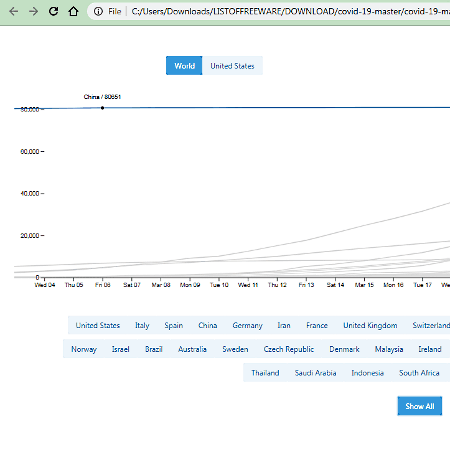
covid-19 is the next free open source coronavirus data analyzer software for Windows. It is one of the simplest web-based software that shows simple graphs to visualize the growth of coronavirus cases in different countries. Let’s checkout its features that you can look forward to.
Main Features:
- World Graph: This section shows a coronavirus growth graph with multiple graph lines. Each graph line represents countries like US, Chine, Iran, India, Thailand, etc. By hovering the mouse over the graph line of a specific country, you can view its number of coronavirus cases, deaths, and recovered people, at any given date during this pandemic.
- United States Graph: This graph shows the growth of coronavirus cases in different states of the United States.
Additional Features:
- Statistics Table: This software also offers a statistics table that shows the country-wise active coronavirus cases, recovered people, and death statistics.
Final Thoughts:
This software offers a simple coronavirus growth graph through which you can analyze the rapid increase of coronavirus cases in different countries.
corona-graphs
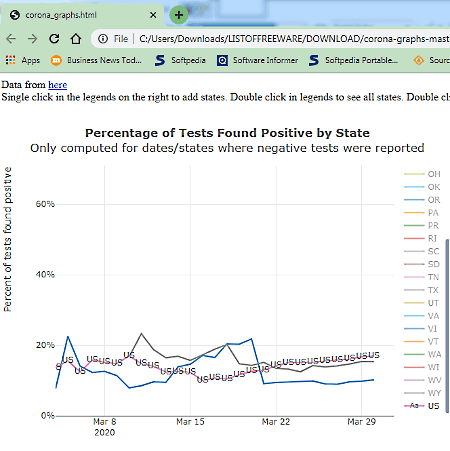
corona-graphs is yet another free open source coronavirus data analyzer software for Windows. You can launch this software with the help of a web browser and start tracking multiple coronavirus graphs highlighting different aspects of this pandemic in the United States. Now, take a brief look at the main features of this software.
Main Features:
- Percentage of Tests Found positive by State: This is an interactive graph that lets you select a state at a time and view the percentage of tests found positive at any given date. By double-clicking over this graph, you can also track the overall percentage of positive cases in the United States.
- Number of Test Carried Out Per Capita By State: This interactive graph gives you both the linear and logarithmic graphs representing the number of people tested compared to the population of the state. By clicking on the shortcode of a state, you can view its graph.
- Total Number of Test Administered by State: It offers linear and logarithmic graphs highlighting the number of tests performed by individual states. By selecting the shortcode of a state, you can view its graph.
- Total Number of Positive Test Results by State: It shows a graph highlight the increase of corona positive people in different states.
Limitation:
- This software only shows the data of United States cases.
Final Thoughts:
It is a simple coronavirus data analyzer software through which you can view and analyze state-wise corona tests and affected people graphs for the United States.


Naveen Kushwaha
Passionate about tech and science, always look for new tech solutions that can help me and others.
About Us

We are the team behind some of the most popular tech blogs, like: I LoveFree Software and Windows 8 Freeware.
More About UsArchives
- May 2024
- April 2024
- March 2024
- February 2024
- January 2024
- December 2023
- November 2023
- October 2023
- September 2023
- August 2023
- July 2023
- June 2023
- May 2023
- April 2023
- March 2023
- February 2023
- January 2023
- December 2022
- November 2022
- October 2022
- September 2022
- August 2022
- July 2022
- June 2022
- May 2022
- April 2022
- March 2022
- February 2022
- January 2022
- December 2021
- November 2021
- October 2021
- September 2021
- August 2021
- July 2021
- June 2021
- May 2021
- April 2021
- March 2021
- February 2021
- January 2021
- December 2020
- November 2020
- October 2020
- September 2020
- August 2020
- July 2020
- June 2020
- May 2020
- April 2020
- March 2020
- February 2020
- January 2020
- December 2019
- November 2019
- October 2019
- September 2019
- August 2019
- July 2019
- June 2019
- May 2019
- April 2019
- March 2019
- February 2019
- January 2019
- December 2018
- November 2018
- October 2018
- September 2018
- August 2018
- July 2018
- June 2018
- May 2018
- April 2018
- March 2018
- February 2018
- January 2018
- December 2017
- November 2017
- October 2017
- September 2017
- August 2017
- July 2017
- June 2017
- May 2017
- April 2017
- March 2017
- February 2017
- January 2017
- December 2016
- November 2016
- October 2016
- September 2016
- August 2016
- July 2016
- June 2016
- May 2016
- April 2016
- March 2016
- February 2016
- January 2016
- December 2015
- November 2015
- October 2015
- September 2015
- August 2015
- July 2015
- June 2015
- May 2015
- April 2015
- March 2015
- February 2015
- January 2015
- December 2014
- November 2014
- October 2014
- September 2014
- August 2014
- July 2014
- June 2014
- May 2014
- April 2014
- March 2014
