5 Best Free Graph Analysis Software For Windows
Here is a list of best free graph analysis software for Windows. Using these software, you can analyze various aspects of a graph of different formats like GEXF, GML, GraphML, etc. Plus, you can also analyze scientific graphs, network graphs, line graphs, etc. with these software. In some software, you can also enter coordinates of a graph to create and analyze it. In all of these, you can analyze graphs, but every software is proficient in analyzing a specific aspect of a graph. Some software are specialized in graph statistics, some in analyzing the visual changes, while some are specialized in analyzing scientific graphs.
Most of these software are quite easy to use, but prior knowledge regarding graph analysis is desirable in many of these software. All of these are perfectly capable graph analysis software which provide you accurate analysis result. The result of the analysis is usually saved by these software in their native project file format. However, some software let you save the graph analysis results in PDF, SVG, PNG, JSON, DML, EMF, etc. formats. Go through the list to find a suitable graph analysis software.
My Favorite Free Graph Analysis Software For Windows:
Tulip is my favorite software because it provides a simplified analysis process and supports the most number of graph formats to import. I also like its ability to show visual changes in graphs that makes analysis much easier. Gephi is also a well featured graph analyzer software.
You can also check out lists of best free Scientific Graph, Social Network Analysis, and Stock Analysis software for Windows.
Tulip
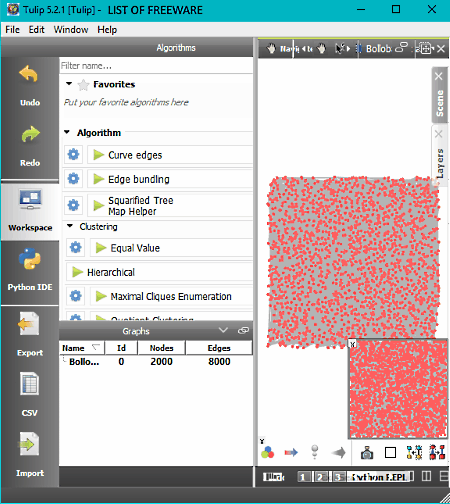
Tulip is a free python-based graph analysis software for Windows. The primary purpose of this software is to analyze and visualize relational data. In it, you can import graphs of various formats like GEXF, GML, GraphML, Pajek, Graphviz, and more. As soon as you import a graph of any supported format, the graph is shown on its interface. Along with graphs, it provides an Algorithms Panel containing a lot of algorithms like cyclic, Connected, Free Tree, Outer Planar, Alpha Mapping, Circular, GEM, and more. In each algorithm, you can modify settings to analyze graph with different settings. For Example, in Curve Edges algorithm, you can modify Curve Roundness, Curve Type, and Bezier Edge.
In this software, you mostly get visual analysis result depending upon the used algorithm. To properly comprehend the result, this software provides tools like navigate in graph, select nodes/edges, select nodes in freehand drawing region, zoom, magnifying glass, etc. Once the analysis gets completed, you can quickly export graphs obtained at different stages of the analysis as SVG, JSON, DML, etc. files. All the obtained numerical data can also be saved separately in a separate CSV file.
In general, it is a feature-rich graph analysis software through which you can analyze various aspects of a graph.
Gephi
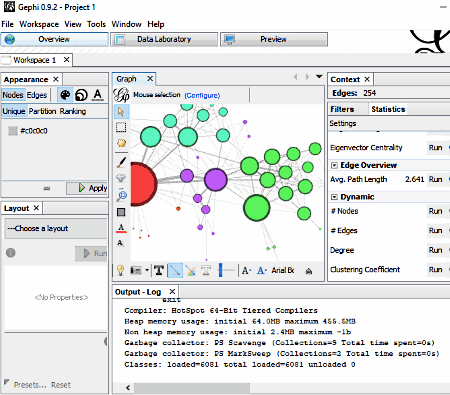
Gephi is a free open source graph analysis software for Windows. Using it, you can analyze graphs present in Gephi, Graphviz, GDF, GEXF, GML, and GraohML files. It is not only used to analyze graphs, but also for the analysis of exploratory data, link, and biological network. In it, you get various dedicated statistics section to extract and analyze various aspects of the graph. All the statistics are available on the Statistics section which is present on the right side of the interface. In the statistics section, you mainly get four types of graph statistics namely Network Overview Statistics, Node Overview Statistics, Edge Overview Statistics, and Dynamic Statistics.
Let’s take a look at all four Graph statistics types which help in analyzing a graph:
- Network Overview Statistics: In it, you can find out average degree, network diagram, graph density, modularity, page rank, connected components, etc.
- Node Overview Statistics: It shows the average clustering coefficient and eigenvector centrality values.
- Edge Overview statistics: From here, you can view average path lengths of both directed and undirected network graph values.
- Dynamic Statistics: This shows node, edge, degree, and clustering coefficient statistics of only dynamic network data or graphs.
Apart from analyzing the graph, you can also use it to create a network graph from scratch. All the created or modified graphs can easily be exported as Graph file, PDF, SVG, and PNG files. Overall, it is simple and easy to use graph creation as well as graph analysis software.
SciDAVis
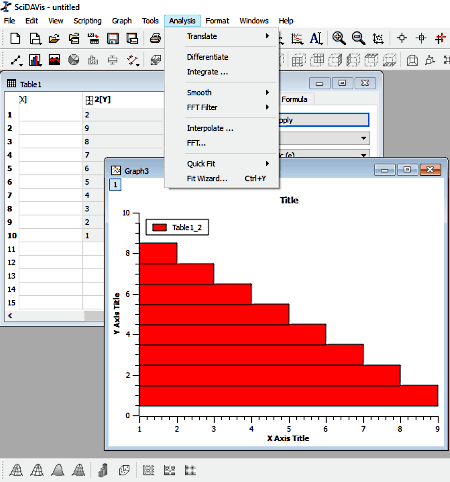
SciDAVis is another free graph analysis software for Windows. It is also used for scientific data analysis and visualization. In this software, you can manually plot a graph and analyze them. It also lets you analyze predefined graphs of formats like OGG, OGV, OPJ, etc. To manually plot graph, go to its Table Window and enter all the graph coordinates to create a graph. After manually plotting a graph or importing a graph, you can start the analysis.
To perform graph analysis, this software provides a dedicated Analysis Tab. In this tab, you get various analysis techniques to use namely FFT, Correlate, Autocorrelate, Convolution, Deconvolution, and Fit Wizard. All these different analysis methods let you analyze the input coordinate values and provide different graphs and results. To analyze the resultant values and graphs, you get simple tools like zoom, select data range, enrichments, statistics on row, statistics on column, etc. After performing the analysis, you can save the obtained analysis results as SciDAVis Project and SciDAVis Template files.
YoshinoGRAPH
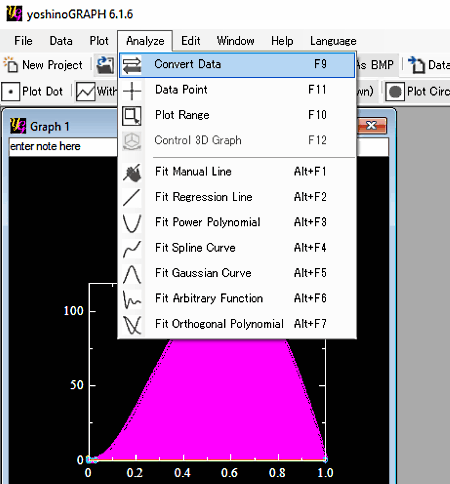
YoshinoGRAPH is yet another free graph analysis software for Windows. This software allows you to generate, view, and analyze various aspects of a graph. In it, you can either perform analysis after creating a graph or by loading graphs of YGP and YGZ YoshnoGRAPH formats. To perform analysis, you can use its Analyze Tab. In its Analyze Tab, it provides various analysis tools like Convert Data, Data Point, Plot Range, Fit Manual Line, Fit Regression Line, Fit Power Polynomial, etc.
Let’s take a look at some of the graph analysis tools:
- Convert Data: It allows you to apply various mathematical functions on the graph like 1/x, log[10]x, exp(x), and more. According to the applied mathematical function, you can see the change in the graph.
- Data Points: Using it, you can analyze all the existing data points of a graph and also edit it to see changes on the graph.
- Plot Range: It shows you the minimum and maximum plot range of the graph that you can also edit if you want.
- Fit Manual Line: Using it, you can view and analyze slope, intercept, t/eV, Ea/ev, etc. values.
- Fit Spline Line: It lets you calculate coefficients using endpoint conditions, division of x-axis value, and z-axis data.
After the analysis, you can save the graph in EMF, BMP, and PNG formats. Plus, an option to save the graph and analysis values as oshnoGRAPH project file is also available in it.
Power Graph Analysis Tools
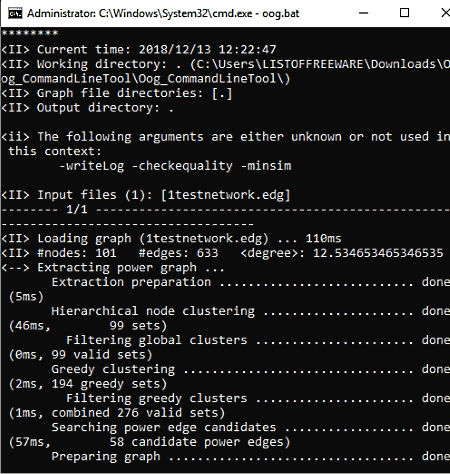
Power Graph Analysis Tools is a free command line based graph analysis software for Windows. Using it, you can analyze graphs of EDG and SIF formats. In it, you will not be able to view the graph or any method that this software applies to the graph to perform the analysis. This software basically takes an input graph file and shows you the output analysis report on its interface.
How to analyze graphs using Power Graph Analysis tools:
- Enter your graph file or files in the same folder as this software.
- After that, launch this software in Command Prompt.
- Now, run the oog.bat file in Command Prompt to get analysis result file of .bbl format. Plus, it also shows all the results on the Command Prompt.
In the result, you get analysis values like number of power edges, number of greedy sets, total number of sets, candidate power edges, pg-index value, edge reduction value, and more. Overall, it is one of the simplest software to perform analysis and to get all the relevant analysis result.


Naveen Kushwaha
Passionate about tech and science, always look for new tech solutions that can help me and others.
About Us

We are the team behind some of the most popular tech blogs, like: I LoveFree Software and Windows 8 Freeware.
More About UsArchives
- May 2024
- April 2024
- March 2024
- February 2024
- January 2024
- December 2023
- November 2023
- October 2023
- September 2023
- August 2023
- July 2023
- June 2023
- May 2023
- April 2023
- March 2023
- February 2023
- January 2023
- December 2022
- November 2022
- October 2022
- September 2022
- August 2022
- July 2022
- June 2022
- May 2022
- April 2022
- March 2022
- February 2022
- January 2022
- December 2021
- November 2021
- October 2021
- September 2021
- August 2021
- July 2021
- June 2021
- May 2021
- April 2021
- March 2021
- February 2021
- January 2021
- December 2020
- November 2020
- October 2020
- September 2020
- August 2020
- July 2020
- June 2020
- May 2020
- April 2020
- March 2020
- February 2020
- January 2020
- December 2019
- November 2019
- October 2019
- September 2019
- August 2019
- July 2019
- June 2019
- May 2019
- April 2019
- March 2019
- February 2019
- January 2019
- December 2018
- November 2018
- October 2018
- September 2018
- August 2018
- July 2018
- June 2018
- May 2018
- April 2018
- March 2018
- February 2018
- January 2018
- December 2017
- November 2017
- October 2017
- September 2017
- August 2017
- July 2017
- June 2017
- May 2017
- April 2017
- March 2017
- February 2017
- January 2017
- December 2016
- November 2016
- October 2016
- September 2016
- August 2016
- July 2016
- June 2016
- May 2016
- April 2016
- March 2016
- February 2016
- January 2016
- December 2015
- November 2015
- October 2015
- September 2015
- August 2015
- July 2015
- June 2015
- May 2015
- April 2015
- March 2015
- February 2015
- January 2015
- December 2014
- November 2014
- October 2014
- September 2014
- August 2014
- July 2014
- June 2014
- May 2014
- April 2014
- March 2014
