7 Best Free Scientific Graph Software For Windows
Here is a list of best free scientific graph software for Windows. Using these software, you can create graphs using mathematical and scientific equations. Along with scientific graphs, you can also plot standard XY-coordinate graphs. Some of the most common types of graphs that these software can plot are function f(x) graph, line graph, and bar graph. Apart from these graphs, you can also generate 3D graphs using both equations and coordinates. To generate any type of graph, you can manually provide equations and coordiantes or import data file containing the input values. According to the input value, you will get the appropriate scientific graph. In most software, you can easily save the graph in various formats PDF, JPG, PNG, SVG, etc.
In these software, you also get various analyzing tools to analyze the graphs and output values. Plus, fully-fledged scientific calculators to perform complex calculations are also present in some scientific graph software. Go through the list to know more about these scientific graph software.
My Favorite Scientific Graph Software For Windows:
SciDAVis is my favorite software because it lets you create both coordinate and equation based scientific graphs. Plus, its ability to generate various types of 3D graphs using the same coordinate and equations is also impressive. In addition to plot graphs, it can also be used to analyze output graphs and values.
You can also check out lists of best free Line Graph Maker, Graphing Software, and Quadratic Equation Grapher software for Windows.
SciDAVis
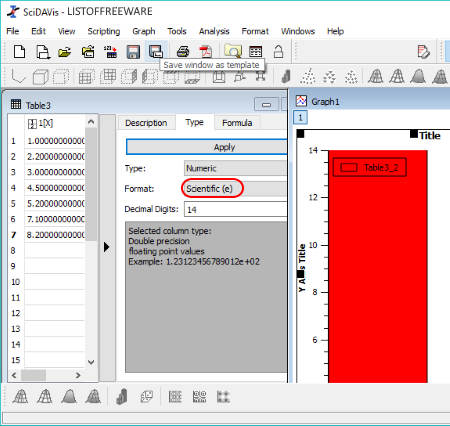
SciDAVis is a free scientific data analysis and graphing software for Windows. Using it, you can easily plot scientific graphs of various types like Line Graph, Scatter Graph, Vertical Bar Graph, Horizontal Bar Graph, etc. In it, you can also plot 3D graphs of four types namely Ribbons, Trajectory, Bars, and Scatter.
In order to plot graphs, you need to create a table with two columns for 2D graphs and three columns for 3D graphs. After that, enter the coordinates values in the table. In the table, you also get a Type menu from where you can change the coordinate format to Scientific (E) or Scientific (e) values. A Formula Menu is also present in the Table to enter scientific formulas. Now, to plot graph, just go to Plot menu and select a graph from various available ones to plot the desired graph. To get a proper look at the graph, you can use Zoom In/Out and Best-Fit tools. After viewing the scientific graph, you can save the graph as BMP, EPS, GIF, PDF, JPG, etc. formats.
In this software, you also get various analysis tools like Interpolate, FFT, Differentiate Integrate, etc. Plus, for 3D graphs, it provides various additional tools to change the orientation of the 3D graph such as front grid, back grid, floor grid, reset rotation, etc.
Veusz
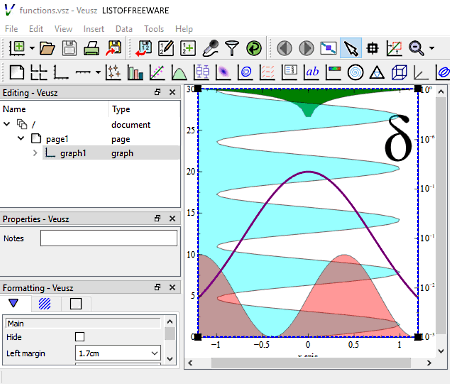
Veusz is a free open source scientific graph software for Windows. In this software, you can produce production-ready 2D and 3D graphs. The process of creating a 2D or 3D scientific graph is pretty simple as you just need to import a coordinate file of CSV, TXT, HDF5, or FITS format to generate graphs. In it, you cannot directly add graph coordinates to this software which is a small drawback of this software. To convert coordinates to a graph, you need to add X, Y, and Z coordinates of the graph with the columns of the imported coordinates’ file using its Properties field. After that, select the type of graph that you want to plot from its toolbar such as Points, Bar Chart, Function To Data, Function, Vector Field, Box Plots, etc. As soon as values of coordinate columns get attached with the coordinates (X, Y, and Z), you can immediately view the resultant graph. The resultant graph can easily be exported as SVG, PDF, EMF, PNG, JPG, BMP, etc. formats.
In this software, you cannot only create simple graphs with black outlines and white background, but fully colored graphs can also be created in it. You can use its Color menu to define different colors to highlight different aspects of the graph. Plus, it also lets you add 3D elements, grid, label, shapes, etc. to existing graphs. Overall, it is really good software to create 2D and 3D scientific graphs.
YoshinoGraph
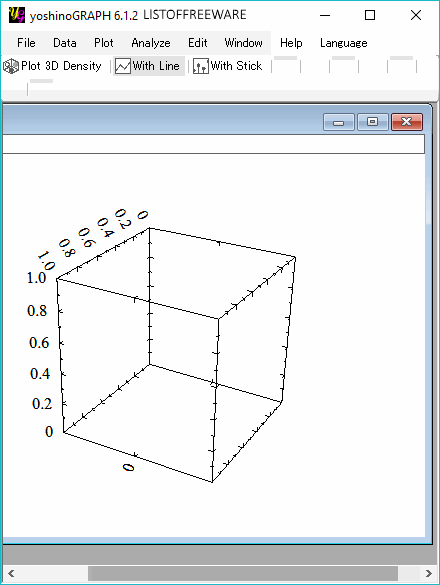
YoshinoGraph is another free scientific graph software for Windows. It is used to create scientific graphs for data analysis. In it, you can quickly create 2D and 3D graphs from data files of TXT and CSV formats. After importing coordinates or data, you can choose the type of graph plotting method (Circle, Dot, Symbol, Density, and Vector) from its Plot section. In the case of the 3D graph, you can select one of the three available 3D graph plotting methods namely 3D circle, 3D Dot, and 3D Density. Besides this, you can also add grid to the background of the graphs to get the classic graph view. To draw scientific graphs, it provides an Expression option that allows you to draw graphs according to mathematical or scientific expressions like y=sin x, y= 1/2 cos x, etc.
This software also comes with a dedicated Analyze menu that allows you to convert plot data, set data point, and set plot range. Plus, options to manually define plot lines, regression lines, Gaussian curve, and arbitrary function for graph analysis is also present in the Analyze menu. After plotting and analyzing the scientific graph, you can save it as EMF, BMP, and PNG formats.
I See Graphs
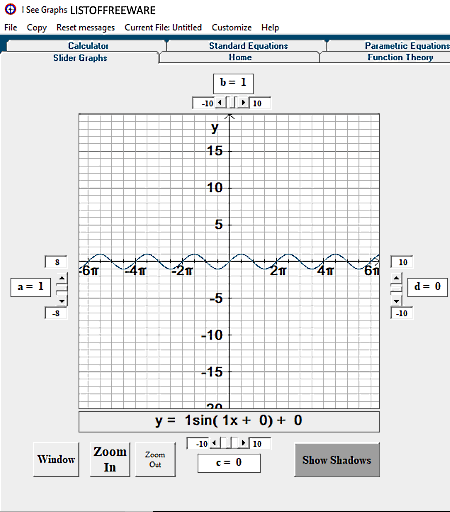
I See Graphs is yet another free scientific graph software for Windows. This software is specially designed for teachers to teach graph making process to their students. Using it, you can easily create various different types of scientific graphs like Slider Graphs, Function Theory, Inequalities, Probability, 3D Graphs, Matrices, and more. For each type of graph, it provides a dedicated section. By going to a specific section, you can input equations and coordinate values to plot the graph. Within each section, you get the corresponding graph, but you cannot export or save the graph. However, you can still save data and equations as DAC and IC files respectively. After plotting the graph, you can use Zoom In, Zoom Out, and Show Shadows tools to analyze the graph.
This software also comes with a fully fledged scientific calculator to help you solve equations. Apart from various tools and features, it also provides a really customizable interface that lets you select any combination of primary and secondary colors.
fx-Calc
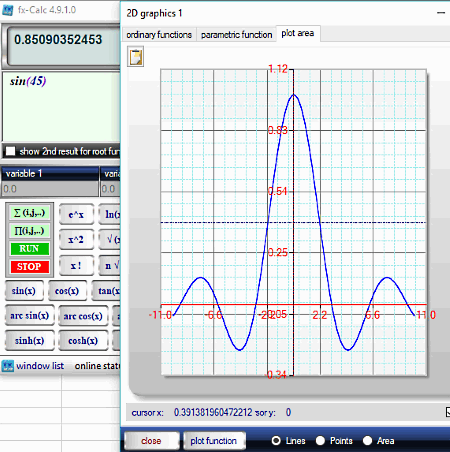
fx-Calc is one more free scientific calculator software through which you can also plot scientific graphs. As a scientific calculator, it provides all important function, numerical keys, and calculation keys on its interface to perform mathematical and scientific calculations. Along with standard scientific calculator features, you also get various graph plotting features namely 3D surface, regression, fx graphics, and fx analyze.
Let’s take a look at all four available graph plotting features:
- 3D Surface: According to its name, it is used to plot 3D graphs. Using it, you can create a 3D graph from two variable functions or vector equation. The 3D graph can be viewed on OpenGL 3D tab from where you can also change the orientation of graph through mouse.
- Regression: It is used to plot 2D graph of the regression function. In it, you can provide the whole equation along with multiple values of X and Y coordinates to plot the graph.
- fx Graphics: Using it, you can plot a 2D graph for Ordinary and Parametric Functions. You just need to provide the appropriate equation to get the graph on its Plot Area section.
- fx Analyse: It is used to analyze a single variable function equation by providing its definite integral graph, tangent graph, and function plot graph.
Overall, it is pretty easy to plot scientific graphs in this software, but this software does not allow you to save any of the graphs.
Dream Calc
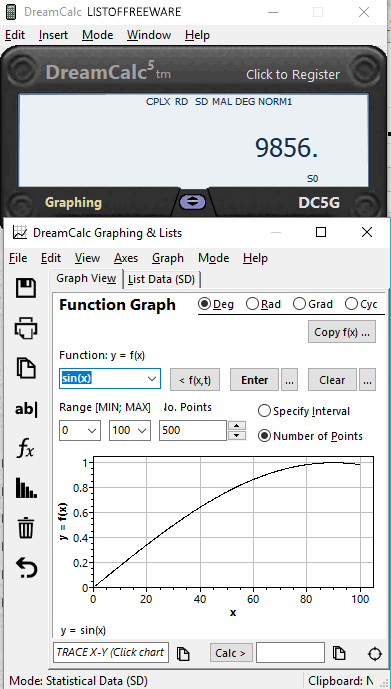
Dream Calc is a free scientific calculator software that also lets you plot scientific graphs. The main interface of this software is dominated by a virtual scientific calculator in which you can perform complex calculations. To access its Graphing feature, you need to press the F12 hotkey or access it from its Windows Menu. Using its graphing section, you can plot X-Y Graph, Scatter Plot, Line & Point, Bars, along with advanced Function graphs.
To draw coordinate (X and Y) based graphs namely X-Y graph, Scatter Plot, Line & Point, and Bar graphs, you need to input coordinates on the List data tab of Graphing Section. Now, to plot function based graphs, you need to enter equations like y=sin(x), y=cos(x), etc. in the Graph View tab of Graphing section. At any time, you can also change the unit of input coordinates to Degree, Radian, Grad, and Cycle to get output graph accordingly. The resultant graph can be viewed from the Graph View tab that you can also save as JPG, BMP, and EMF image formats.
RJS Graph
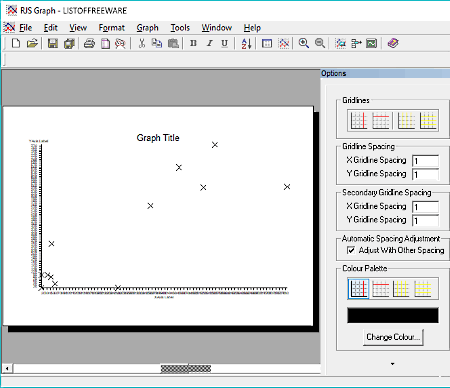
RJS Graph is the next free scientific graph software for Windows. This software is used to create professional 2D scientific graphs. It also provides various analysis tools to analyze the graph. In it, you can enter both the standard graph values along with equations to plot standard and scientific graphs.
To create a graph, you can either directly enter fresh coordinates or equations to this software or import data files of TXT and CSV formats to plot graph. After plotting the graph, you can add horizontal/vertical grid lines, fit lines, axes, borders, data lines, etc. to the graph using the Options section. After plotting the desired graph, you can export it as PS or EMF file. Apart from plotting the graph, you can also use its inbuilt scientific calculator to solve problems.


Naveen Kushwaha
Passionate about tech and science, always look for new tech solutions that can help me and others.
About Us

We are the team behind some of the most popular tech blogs, like: I LoveFree Software and Windows 8 Freeware.
More About UsArchives
- May 2024
- April 2024
- March 2024
- February 2024
- January 2024
- December 2023
- November 2023
- October 2023
- September 2023
- August 2023
- July 2023
- June 2023
- May 2023
- April 2023
- March 2023
- February 2023
- January 2023
- December 2022
- November 2022
- October 2022
- September 2022
- August 2022
- July 2022
- June 2022
- May 2022
- April 2022
- March 2022
- February 2022
- January 2022
- December 2021
- November 2021
- October 2021
- September 2021
- August 2021
- July 2021
- June 2021
- May 2021
- April 2021
- March 2021
- February 2021
- January 2021
- December 2020
- November 2020
- October 2020
- September 2020
- August 2020
- July 2020
- June 2020
- May 2020
- April 2020
- March 2020
- February 2020
- January 2020
- December 2019
- November 2019
- October 2019
- September 2019
- August 2019
- July 2019
- June 2019
- May 2019
- April 2019
- March 2019
- February 2019
- January 2019
- December 2018
- November 2018
- October 2018
- September 2018
- August 2018
- July 2018
- June 2018
- May 2018
- April 2018
- March 2018
- February 2018
- January 2018
- December 2017
- November 2017
- October 2017
- September 2017
- August 2017
- July 2017
- June 2017
- May 2017
- April 2017
- March 2017
- February 2017
- January 2017
- December 2016
- November 2016
- October 2016
- September 2016
- August 2016
- July 2016
- June 2016
- May 2016
- April 2016
- March 2016
- February 2016
- January 2016
- December 2015
- November 2015
- October 2015
- September 2015
- August 2015
- July 2015
- June 2015
- May 2015
- April 2015
- March 2015
- February 2015
- January 2015
- December 2014
- November 2014
- October 2014
- September 2014
- August 2014
- July 2014
- June 2014
- May 2014
- April 2014
- March 2014
