9 Best Free Dot Plot Maker Software For Windows
Here is a list of best free dot plot maker software for Windows. A dot plot chart is a type of data visualization graph which is used to describe quantitative values associated with categorical variables. For Example- names of preferred snacks by students (categorical variable) and number of students preferred a particular snack (quantitative value). This chart is quite similar to a bar graph and used for the same purpose which is to organize and analyze statistical data. If you already have all the variables and their values, then you can use these software to create a dot plot chart.
Most of these software are mainly office software which offer multiple productivity modules like spreadsheet, document, presentation, etc. However, to create a dot plot chart, you only need their spreadsheet module. The spreadsheet comes with a Chart Creation feature. Inside the Chart section, you get the essential XY (scatter) chart feature to make a dot plot chart. A few of these software are dedicated chart maker software which allow you to quickly create various types of charts. The process of creating a dot plot chart is quite simple. I have also included the steps to create the chart in the description of each software.
The good thing about these software is that they can also be used to create charts of different types like bar chart, pie chart, bubble chart, area chart, etc. I also like the ability of these dot plot chart makers to save the final chart in formats like DOC, XLS, CALC, CSV, ODF, etc. Go through the list to know more about these software.
My Favorite Dot Plot Maker Software For Windows:
LibreOffice is my favorite software because it allows you to create multiple types of charts along with the dot plot chart. Plus, it allows you to modify various chart properties after creating a chart.
DBPlot is also great as it can be used for creation of different types of data visualization charts including a dot plot.
You can also check out lists of best free Family Tree Chart Maker, Bar Chart Maker, and Pie Chart Maker software for Windows.
LibreOffice
LibreOffice is a free open source dot plot maker software for Windows, macOS, and Linux. This software comes with multiple office modules for productivity tasks as it is mainly an office software. Some of the modules which it provides are LibreOffice Impression, LibreOffice Draw, LibreOffice Calc, LibreOffice Writer, etc.
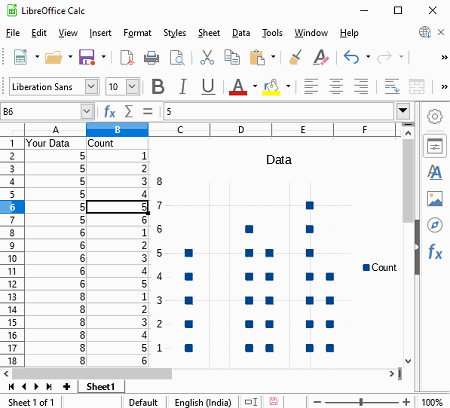
However, you only need its LibreOffice Calc module to create a dot plot. To make a dot plot chart, you need to create at least two columns representing a categorical variable and quantitative value, for example, a group of students with different age and number of students with the same age (quantitative value). After creating two columns, you can start the dot plot chart creation process.
How to create a dot plot chart using LibreOffice:
- Start this software and Open a new spreadsheet.
- After that, create two columns as mentioned above and enter groups and frequency values in the rows of created columns. Or, you can import data entries from any supported files like XLSX, XLS, CSV, XML, XLT, ETT, DIF, WKS, ODS, etc.
- Next, select both the columns with all their values and go to Insert > Chart section.
- From the chart section, you need to select the XY (Scatter) chart.
- Now, you get options to specify and customize x-axis name, y-axis name, chart name, chart range, data series, etc.
- Specify all required values and click on the Finish button to view the finished dot plot chart on the main interface.
On the Chart, you can view dots in a vertical building like structure representing the selected dataset. You can save both the chart and spreadsheet in formats like CALC, CSV, ODF, XLS, etc. The dot plot graph can be saved separately as an image like PNG, BMP, JPG, GIF, WMF, TIF, SVG, etc.
Additional Features:
- Protect Sheet: Using it, you can password protect your spreadsheet to avoid unauthorized access.
- Insert: It is a tab that allows you to insert various elements over a spreadsheet such as Font work, Hyperlink, Text Box, Images, Charts, and more.
Final Thoughts:
It is one of the best free dot plot maker software as it lets you quickly create multiple variable dot plot charts. You can also create Bar, Column, Pie, Area, Line, Bubble, Net, Column and Line, and Stock charts in it.
DBPlot
DBPlot is another free open source dot plot maker software for Windows. Apart from a dot plot, you can also use it to create charts of different types such as Pie Chart, Regression Chart, Bar Chart, Box Plot, Pyramid, etc. However, unlike other similar software, it does not let you manually enter the parameters and values of charts. Thus, to create a dot plot chart through this chart maker, you need to import chart values from files like CSV, DBS, XLS, etc.
How to create a dot plot chart using DBPlot:
- Launch this software and add a Data Source to it by dropping the data file of a supported format on its Data Source panel.
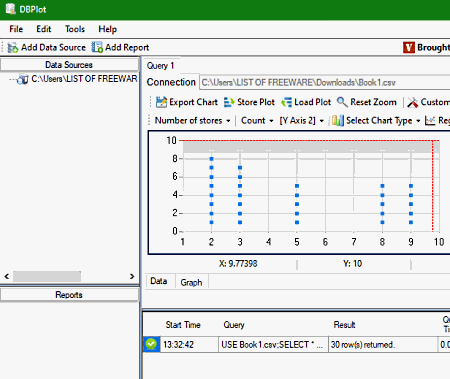
- After that, you can view the data of the input file in the Data section.
- Now, go to the Graph section where you can view two drop-down menus on the top part of the graph. In both the menus, you can view the heading of both the parameters.
- Next, you need to select that parameter which is representing the categorical variables in the first drop-down menu.
- After that, select another parameter heading in the second menu to view the dot plot chart.
- Lastly, use the Export Chart option to export the final dot plot chart in BMP, JPEG, GIF, and PNG formats.
Additional Features:
- Regression: It is a dedicated regression chart maker feature that allows you to create various types of regression charts like Linear, Polynomial, Exponential, Logarithmic, etc.
- Full-Screen Mode: It enables you to view charts in the fullscreen mode.
Final Thoughts:
It is a great dedicated data visualization software through which you can create a dot plot chart, regression chart, line chart, etc., with ease.
SciEnPlot
SciEnPlot is yet another free open source dot plot maker software for Windows and macOS. It is a dedicated data plotting software designed especially for engineers and scientists so that they can visualize data in the form of graphs.
Similar to office software, it also offers a spreadsheet on its interface that allows you to manually enter the parameters and their values. However, you can also import data in this software in the form of CSV and TXT files. After importing the data, you can choose one of many available chart types from its interface like SymPlot, CMapPlot, 3DPlot, etc. To create a dot plot chart, you only required its SymPlot chart type. You can follow the below steps to create a dot plot chart through this software.
How to make a dot plot chart using SciEnplot:
- Start this software and manually name two columns according to the parameter names and then enter values of parameters in the rows. You can also directly import the data in form of CSV and TXT file formats.
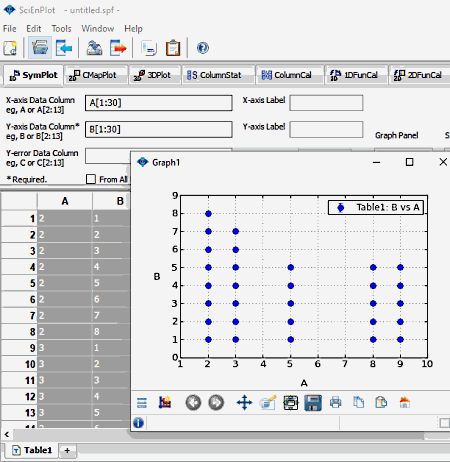
- Next, select all the values of a parameter column and then go to SymPlot tab and click on the X-axis Data Column field to enter data range of the selected column in the X-axis field. Similarly, select the values of the second parameter column and click on the Y-axis Data Column field.
- Now, you can label the X and Y-axis by entering the parameter names in the X-axis Label and Y-axis Label fields. Other modifications like dot plot symbol (circle, square, diamond, etc.), symbol color, etc., can also be performed using the on-screen modification tools.
- Lastly, click on the Plot button to immediately view the dot plot chart on the main interface.
On the dot plot chart, you get a save option using which you can export the dot plot chart in various image formats like PNG, BMP, TIFF, RAW, JPEG, etc.
Additional Features:
- Export: Using it, you can export the chart values in TXT and CSV file formats.
- 3D Plot: It is an advanced chart plotting feature that lets you plot 3D charts.
Final Thoughts:
It is a good chart plotting software that offers multiple data plotting tools and features using which you can easily create a dot plot chart and many other types of charts.
Gnumeric
Gnumeric is the next free dot plot maker software for Windows. It is primarily a spreadsheet software through which you can store and manage a large set of data and values. Plus, all the essential spreadsheet features are also present in it. One of the important spreadsheet feature namely Chart is also present in it that enables you to create a dot plot and many other types of charts.
How to make a dot plot chart using Gnumeric:
- Start this software and create a new spreadsheet.
- After that, name two columns of the spreadsheet according to the parameters for which you are creating a dot plot chart.
- In the next step, specify all the values of both the parameters in parameters rows.
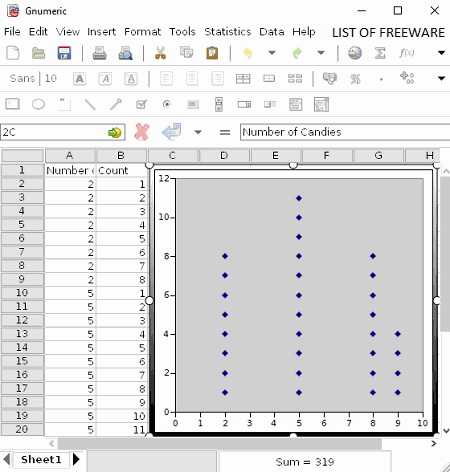
- Now, select all the values of both the parameter rows and open up the Chart section.
- In the Chart section, you can view many different types of charts like Area, Bar, Bubble, XY, etc. You need to select the XY chart. As soon as you click on the XY chart, you can view the dot plot chart on its interface.
- Next, double-click on the dot plot chart to open up its Customize Chart section from where you can adjust X & Y-axis layout (style, font, text, etc.), plot area, object position, chart background color, etc.
- Once the chart gets completed, use the Save option to save it in XML, ODS, XLS, SYLK, etc., formats.
Final Thoughts:
It is a dedicated spreadsheet software through which you can quickly create various types of charts including a dot plot chart.
WPS Office
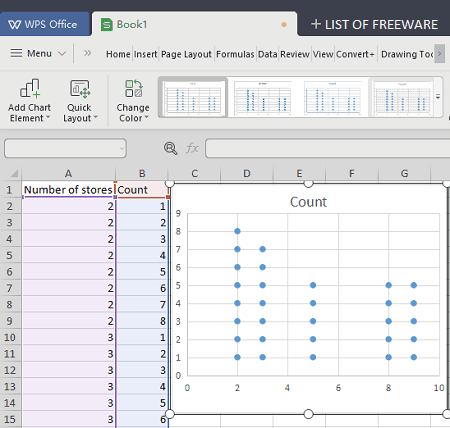
WPS Office is another free office software that can also be used as a dot plot maker. It works on Windows, macOS, iOS, Android, and Linux. This office software comes with three office modules like WPS Spreadsheet, WPS Writer, WPS, Presentation, etc. You need to use its WPS spreadsheet module as it offers all the essential tools to create a dot plot chart.
How to create a dot plot chart using WPS Office:
- Start this software and open up its Spreadsheet module.
- Next, create a new spreadsheet and specify the name of two columns according to the parameters which you have like a group of values and frequency of values.
- Now, enter the values of both the parameters in the rows of specified parameters over the spreadsheet.
- After that, select all the values of both the columns and then move to the Insert > Chart section.
- From the chart section, select the XY (Scatter) chart to immediately view the dot plot chart on the interface.
- Now, to specify chart title, label position, axis position, chart effects, text direction, etc., use the Format Chart Area option.
- After completing the dot plot chart, you can save the chart separately in CRTX template format. You can also save both the chart and spreadsheet in formats like XLS, HTML, CSV, DIF, etc.
Additional Features:
- Encrypt: According to its name, this feature helps you encrypt your documents so that no unauthorized user can access it.
- Convert: It is an inbuilt file conversion feature of this software that allows you to change the format of documents of different formats like PDF, DOC, PPT, XLSX, etc.
- Protect Sheets: This feature is specially designed to protect certain cells of spreadsheet from editing.
Limitations:
- This software shows ads in the form of popups. To remove ads, you need to purchase the paid version of this software.
Final Thoughts:
It is another decent dot plot maker software through which you can also create line charts, bar charts, pie charts, etc.
ONLYOFFICE
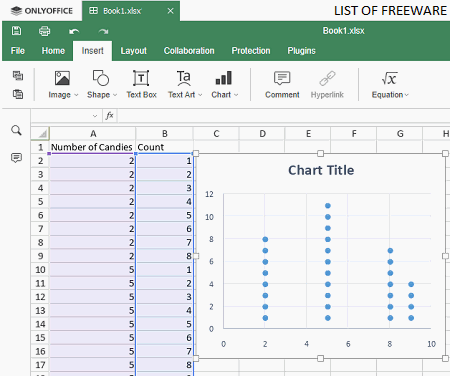
ONLYOFFICE is yet another free dot plot maker software for Windows, macOS, and Linux. As its name implies, it is also an office software that offers multiple productivity modules namely Spreadsheet, Document, and Presentation. However, from all its productivity modules, you only need its Spreadsheet module to make a dot plot chart as it offers the essential chart section.
How to create a dot plot chart using ONLYOFFICE:
- Launch this software and open up its Spreadsheet module.
- Now, create a blank spreadsheet and assign names to at least two columns according to the parameters you are working with.
- After that, enter the groups and frequency values in the rows of created parameter columns.
- Next, select both the columns and their values and go to Insert > Chart section and choose the XY (Scatter) chart to view the dot plot chart on its interface.
- Now, use the Chart Advanced Settings to set chart properties and characteristics like vertical axis label, horizontal axis label, max axis value, min axis value, data range, etc.
- Lastly, use the Save option to save the spreadsheet along with the chart in formats like ODS, CSV, XLXS, etc.
Additional Features:
- Protection: It is a tool to protect spreadsheets by encrypting them using a secure encryption algorithm like AES-256.
- Insert: It is another handy feature that not only lets you add charts to a spreadsheet but also lets you add shapes, text boxes, images, objects, etc., elements.
Final Thoughts:
It is another easy to use dot plot maker software through which you can easily create beautiful dot plot charts with ease.
ooO4Kids
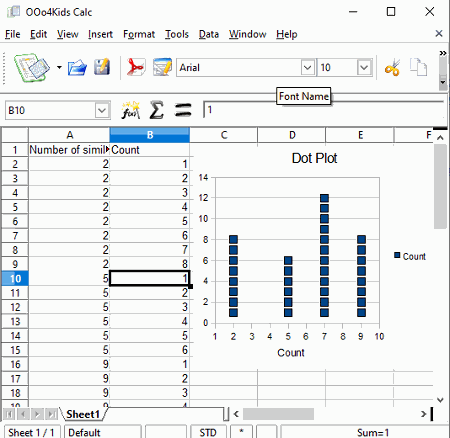
OOo4Kids is one more free office software that also acts as a dot plot maker. It works on Windows. As its name implies, it is primarily built for kids, thus, it is much simpler to use. However, similar to other office software, it does offer multiple office modules such as Spreadsheet, Drawing, Formula, etc. By using the spreadsheet module of this software, you can easily create a dot plot chart.
How to make a dot plot chart using OOo4Kids:
- Launch this software and open up its Spreadsheet module.
- Next, name two columns according to two input parameters, e.g., a group of students with different age and number of students with the same age. And, enter the values of both the parameters in rows.
- Now, select all the values of both the columns and go to Insert > Chart section.
- In the Chart section, you can view various types of charts like Bar, Column, XY (Scatter), Bubble, etc., You need to select the XY (Scatter) chart in order to generate a dot plot graph.
- After that, specify chart data range, data series, and chart elements (Title, subtitle, X-Axis Name, etc.).
- Lastly, click on the Finish button to view the dot plot chart on its interface.
You can use the Save option to save the plotted graph in formats like XML, CSV, XLT, ODF, XLS, etc.
Final Thoughts:
It is a simple yet feature rich-dot plot maker software through which you can create multiple types of charts and manage a large set of entries and data.
IBM Lotus Symphony
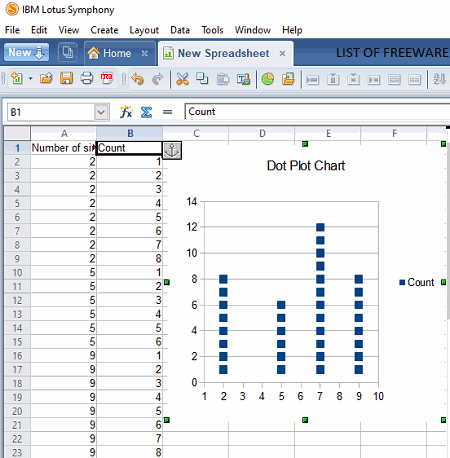
IBM Lotus Symphony is yet another free dot plot maker software for Windows. This software also acts as an office software that offers three essential office applications namely Document, Presentation, and Spreadsheet. By using the Spreadsheet module of this software, you will be able to create a dot plot chart. All the essential spreadsheet features are present in this spreadsheet module.
How to create a dot plot chart using IBM Lotus Symphony:
- Start this software and choose the Spreadsheet module of this software.
- After that, create a new spreadsheet and name two columns of the spreadsheet according to the two input parameters.
- Next, enter the values of both the parameters in the corresponding rows of the parameters.
- From the Chart Wizard, you need to select the XY (Scatter) chart.
- After that, specify Data Range, Data Series, and Chart Elements (Title, name of x & y-axis, display grid, etc.).
- At last, press the Finish button to complete the dot plot chart.
To save the final chart along with the spreadsheet, use the save option that lets you save it in formats like SXC, STC, XLT, CSV, ODT, ODS, etc.
Additional Features:
- Protect Document: Use this feature to password protect your documents so that only authorized users can access it.
- Compare Documents: According to its name, this feature allows you to compare two documents so that you can find all the similarities and differences between them.
Final Thoughts:
It is a simple office software through which you can also make a dot plot chart and perform multiple productivity tasks.
SoftMaker Free Office
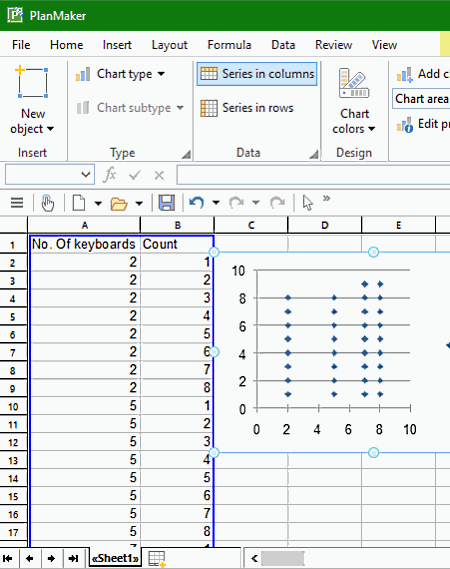
SoftMaker Free Office is the next free dot plot maker software for Windows. Like many other listed software, it is a standard office software that allows you to create dot plot charts. In it, you can find multiple office modules namely PlanMaker, Presentations, and Textmaker. By using the PlanMaker module of this software, you can create a dot plot chart. The PlanMaker module is basically a spreadsheet software that contains essential Chart section. Through its chart section, you can create many types of charts like a bar chart, pie chart, dot plot chart, line chart, etc.
How to create a dot plot chart using SoftMaker Free Office:
- Launch this software and open up its PlanMaker module.
- Now, enter the names of two dot plot parameters in any two columns of the spreadsheet.
- After that, enter the values of parameters in the rows of respective columns.
- Next, select both the columns with all their values and then open up the Chart section by going to the Insert tab.
- From the chart section, select the XY Scatter chart and press Apply to immediately view a dot plot chart on the interface.
- Now, double-click over the dot plot chart to open up a Properties window from where you can adjust chart properties line thickness, colors of graphs, format, font, etc.
After creating a dot plot chart, use the Save option to save it in formats like PPT, TMDX, SLK, CSV, XLS, etc.
Additional Feature:
- Sheet Protection: It is a handy feature that helps you protect your spreadsheets by setting a password lock to sheets.
Final Thoughts:
It is one more standard office software that offers all essential dot plot chart making features.


Naveen Kushwaha
Passionate about tech and science, always look for new tech solutions that can help me and others.
About Us

We are the team behind some of the most popular tech blogs, like: I LoveFree Software and Windows 8 Freeware.
More About UsArchives
- May 2024
- April 2024
- March 2024
- February 2024
- January 2024
- December 2023
- November 2023
- October 2023
- September 2023
- August 2023
- July 2023
- June 2023
- May 2023
- April 2023
- March 2023
- February 2023
- January 2023
- December 2022
- November 2022
- October 2022
- September 2022
- August 2022
- July 2022
- June 2022
- May 2022
- April 2022
- March 2022
- February 2022
- January 2022
- December 2021
- November 2021
- October 2021
- September 2021
- August 2021
- July 2021
- June 2021
- May 2021
- April 2021
- March 2021
- February 2021
- January 2021
- December 2020
- November 2020
- October 2020
- September 2020
- August 2020
- July 2020
- June 2020
- May 2020
- April 2020
- March 2020
- February 2020
- January 2020
- December 2019
- November 2019
- October 2019
- September 2019
- August 2019
- July 2019
- June 2019
- May 2019
- April 2019
- March 2019
- February 2019
- January 2019
- December 2018
- November 2018
- October 2018
- September 2018
- August 2018
- July 2018
- June 2018
- May 2018
- April 2018
- March 2018
- February 2018
- January 2018
- December 2017
- November 2017
- October 2017
- September 2017
- August 2017
- July 2017
- June 2017
- May 2017
- April 2017
- March 2017
- February 2017
- January 2017
- December 2016
- November 2016
- October 2016
- September 2016
- August 2016
- July 2016
- June 2016
- May 2016
- April 2016
- March 2016
- February 2016
- January 2016
- December 2015
- November 2015
- October 2015
- September 2015
- August 2015
- July 2015
- June 2015
- May 2015
- April 2015
- March 2015
- February 2015
- January 2015
- December 2014
- November 2014
- October 2014
- September 2014
- August 2014
- July 2014
- June 2014
- May 2014
- April 2014
- March 2014
