3 Best Free Ecosystem Software For Windows
Here is a list of Best Free Ecosystem Software For Windows. Using these free software, you can build Ecosystems and analyze the ecological responses among various functional groups and organisms. To do so, these ecosystem modeling software facilitate you with essential tools to describe your model (name, author, location, model type, etc.), add various scenarios, add relationships to your models, etc. And with respect to added details, you get statistical reports and summarised data related to your ecosystem model.
One of these is a feature-rich ecosystem simulator. Using it, you can add various species (seals, birds, sharks, demersal, flatfish, phytoplankton, corals, toothed whales, etc.) and specify different input parameters (habitat area, biomass, production/biomass, consumption/biomass, mortality, detritus import, etc.). As a result, you get analysis reports including basic estimates, mortality rate, key indices, flow diagram, electivity, search rates, etc. statistics.
Overall, these free ecosystem software are pretty good at what they do. To learn about their respective features in detail, these software provide dedicated help centers.
My Favorite Ecosystem Software:
Ecopath with Ecosim is my favorite ecosystem simulation software. It is the best ecosystem software in this list having a variety of tools to perform environmental studies on ecosystems. It provides detailed reports in the form of graphs as well as summaries. It is a highly recommended software for the educational purpose. Plus, all features with elaboration are explained in its Help menu, which makes it easy to understand.
Also, you can checkout lists of best free Energy Modeling Software and Genetic Heredity Calculator software for Windows.
Ecopath with Ecosim

Ecopath with Ecosim (EwE) is a featured ecosystem modeling software. It comes with some inbuilt ecosystem projects which you can use to get started with this software.
It has three main modules which facilitate you to create and analyze different ecosystem models. Let’s checkout these components and their working in detail.
1. Ecopath
In this module, you have to provide basic description and parameters of your ecosystem model. To start with, you need to enter model parameters such as name, model year, model area, description, publication, ecosystem type, country, biodiversity index, etc. Next, you have to add functional groups i.e. a set of species, like seals, birds, sharks, demersal, flatfish, phytoplankton, corals, toothed whales, baleen whales, etc. You can categorize these groups as consumer, producer, or detritus. Now, you can add values for basic input (habitat area, biomass, production/biomass, consumption/biomass, ecotrophic efficiency, mortality, detritus import, etc.), diet composition, detritus rate, other production (immigration, emigration, etc.), fishery (fleets definition, landing, discard, non-market price, etc.), and tools (growth input, pedigree, traits).
After setting up the input values for your ecosystem model, save the model. As output, you get basic estimates for trophic level, habitat area, biomass, ecotrophic efficiency, etc. for each functional group. In addition, you also get values of key indices (net efficiency, omnivory index, flow to detritus, net migration), mortality rate (fishing, predation, net, etc. mortality rate), consumption, niche overlap (prey overlap, predator overlap, respiration, ect.), electivity, search rates, fishery (quantity, value), particle size distribution (growth estimates, size weight plot, etc.). It also displays flow diagram of your Ecopath model, related statistics, pre-balanced diagnostics, and network analysis (trophic level decomposition, mixed trophic impact, value chain, ecosystem network analysis, cycles and pathways, ascendency, etc.).
2. Ecosim
Ecosim, as the name suggests, is the time dynamic simulation module to explore and analyze ecosystem policies. In this module, first, you have to describe a scenario and specify run parameters including duration in years, base proportion of free nutrients, minimum foraging time, nutrients loading forcing function, etc. You can add a time series manually or by importing a TXT file. You can view and add group information like feeding time adjust rate, predator effect on feeding time, switching power parameter, etc. There is a Vulnerabilities option which provides an Estimate Vulnerabilities tool. Using it, you can estimate vulnerability of groups with respect to carrying capacity/biomass. Other input parameters include mediation, forcing function, functional responses, egg production, fishing effort, fishing mortality, price elasticity, fleet size dynamics. Now, let’s see the output features you get.
- Ecosystem Policy Analysis: You can run simulation for the created Ecosim model. It lets you set fishing rate and then generates time series of biomasses in a graph. You can also view the graph for a particular functional group. Other output tools are graph plot (various graphs including biomass, fishing mortality, consumption/biomass, etc.), Ecosim results, Ecosim all fits, Stock-Recruitment plot (multi-stanza groups only), suitability plot (elecitivity, functional response, suitability), and flow diagram.
3. Ecospace
This is a spatial and temporal dynamic module which lets you explore impact and placement of protected areas. Let’s see what are the inputs you need to design Ecospace models and the outputs you get afterward.
- Input: Firstly, you need to describe scenarios, model type, run time, effort calculations, etc. Now, you can edit basemaps, set number of habitats and marine protected regions, assign habitats, add dispersal rate, edit advection map, define Ecospace fishery, and add some other external data.
- Output: Run Ecospace and Ecospace results are two options in its output menu. Using the former one, you can run simulation of your Ecospace project and view graph and map for functional groups. While summarized results are displayed in results tab. It also provides an additional spatial optimization tool to basically evaluate optimum placement of marine protected areas.
Other beneficial features of this ecosystem software:
- It provides some other useful tools called Ecotracer (predicts temporal changes in biomass flows among functional groups) and management procedures (to evaluate biomass mean, catch mean, etc.).
- If your model is not mass balanced or contains some other error, it reports errors in status tab present below its interface. So, you can correct these errors and build a credible ecosystem model.
- It lets you save various output graphs, results, summary, etc. in different formats, such as CSV, BMP image, etc. Also, it provides a Result Extractor tool which lets you export selective results to a CSV file.
- You can install some add-ons (like Ecotrophs) to enhance its functionality.
- It provides some preferences to customize, like color schemes, font, etc. by using Tools > Options. From there, you can manage plugins too, such as Ecological Indicator, Ecotroph, Shape Grid, etc.
Eco Modeller
Eco Modeller is a basic ecosystem modeling software. To download this free software, you need to register an account on its official website first. Let’s see how it works.
Its main interface is divided into different tabs using which you can build ecological response models.
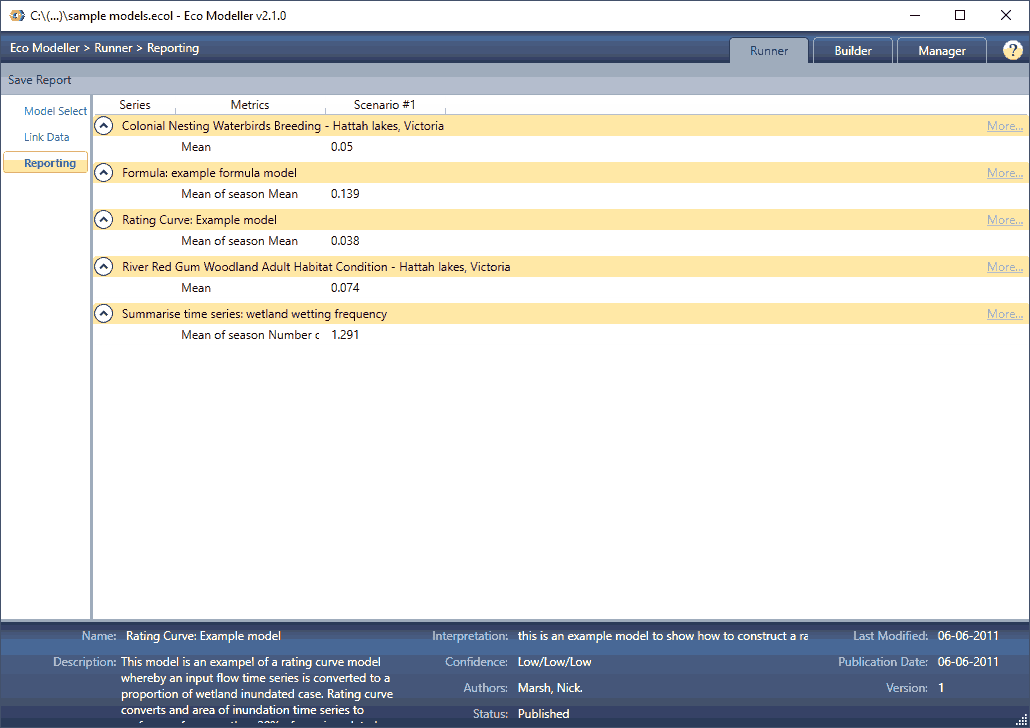
- Builder: It provides a few sample projects to get started with. Or, you can start with a fresh project. You now need to add model summary and description. In model summary, you have to enter the model name, description, interpretation, limitation, author, and location. You can attach a documentation file from your PC to support your model or you can do so using a valid URL. It displays the confidence score of added data. Now for model description, it lets you specify model type (rating curve, summarise time series, hydraulic rule, waterhole model, generic species based model, etc.). As per the specified model type, you need to add the functional details. For example, for hydraulic rule model, I have to add a hydraulic rule by adding association (AND, OR, XOR), predicates, combination (average, maximum, minimum), result (binary, wetted perimeter, surface width), unit, etc. For generic species model, you have to enter species name and add life history stages (by adding habitat drivers). Now finally, you have to enter reporting year and statistics (mean, median, percentile, maximum, minimum) which you want in output.
- Runner: This module carries out the performance analysis and returns model statistics including mean, median, percentile, maximum, minimum, etc. values (as selected in Builder module). For this, firstly, you have to select models from your library, then scenarios data, and finally click on Reporting button. The reports can be saved in CSV format.
There is a Manager tab provided to basically open and create multiple libraries. You can also connect with its online library by logging in. Here, you can view and manage sample data and documentation related to your models.
Eco Modeller is a very simple and limited ecosystem software which lets you create ecological responses models.
HEC-EFM

HEC-EFM, where EFM stands for Ecosystem Function Models, is a free software to perform a statistical analysis of hydrology and ecology relationships. Basically, you can quantify ecosystem responses with respect to variation in a Wetland’s flow regime.
It provides four working tabs which are as follows:
- Properties: Here, you have to enter details of your models which include title, author, location, and description. From the Edit menu, you can add flow regimes, manage tags for geographical queries, select plotting position type (flow frequency, flow duration), select arrays format (DSS, XML), etc. While adding a flow regime, you can attach a DSS, TXT, DAT, CSV, or PRN file to it.
- Relationships: This tab lets you add various relationships and to define these relationships, you need to add statistical queries (season, duration, time series specifications, etc.) and geographical queries (activate added tags for relationships). You can add a new relationship from Edit > Relationship menu.
- Tables: This tab shows statistical reports and output results of the analysis performed.
- Combo Relationships: This is to basically represent a single ecosystem dynamic by grouping two or more relationships.
After designing the model, go to Edit > Recalculate option to perform statistical analysis. Using File > Report option, you get a brief report for your model. Also, results and data summary can be fetched too from the File menu.
It provides an additional HEC-EFM Plotter tool which you can install to plot output analysis report for better data interpretation. After installing it, you can use it from Plot menu. But, this feature didn’t work fine for me during testing.
By using Help > Install Demonstration Project, you can download a sample project just to know how to add input parameters and what output you receive.


About Us

We are the team behind some of the most popular tech blogs, like: I LoveFree Software and Windows 8 Freeware.
More About UsArchives
- May 2024
- April 2024
- March 2024
- February 2024
- January 2024
- December 2023
- November 2023
- October 2023
- September 2023
- August 2023
- July 2023
- June 2023
- May 2023
- April 2023
- March 2023
- February 2023
- January 2023
- December 2022
- November 2022
- October 2022
- September 2022
- August 2022
- July 2022
- June 2022
- May 2022
- April 2022
- March 2022
- February 2022
- January 2022
- December 2021
- November 2021
- October 2021
- September 2021
- August 2021
- July 2021
- June 2021
- May 2021
- April 2021
- March 2021
- February 2021
- January 2021
- December 2020
- November 2020
- October 2020
- September 2020
- August 2020
- July 2020
- June 2020
- May 2020
- April 2020
- March 2020
- February 2020
- January 2020
- December 2019
- November 2019
- October 2019
- September 2019
- August 2019
- July 2019
- June 2019
- May 2019
- April 2019
- March 2019
- February 2019
- January 2019
- December 2018
- November 2018
- October 2018
- September 2018
- August 2018
- July 2018
- June 2018
- May 2018
- April 2018
- March 2018
- February 2018
- January 2018
- December 2017
- November 2017
- October 2017
- September 2017
- August 2017
- July 2017
- June 2017
- May 2017
- April 2017
- March 2017
- February 2017
- January 2017
- December 2016
- November 2016
- October 2016
- September 2016
- August 2016
- July 2016
- June 2016
- May 2016
- April 2016
- March 2016
- February 2016
- January 2016
- December 2015
- November 2015
- October 2015
- September 2015
- August 2015
- July 2015
- June 2015
- May 2015
- April 2015
- March 2015
- February 2015
- January 2015
- December 2014
- November 2014
- October 2014
- September 2014
- August 2014
- July 2014
- June 2014
- May 2014
- April 2014
- March 2014
