8 Best Free GIS Software For Windows
Here is a list of Best Free GIS Software For Windows. GIS stands for Geographical Information System, which is used to analyze, store, manipulate, and visualize the geographic information on a map. GIS is a widely used software and has applications in various fields, like agriculture, astronomy, archeology, architecture, banking, aviation, etc.
In order to start your project, you need shapefiles. Some websites provide free shapefiles of different countries. The links to download free shapefiles are: DIVA-GIS, MapCruzin, GADM, Natural Earth, Mapzen. You can use these in all of these free GIS software.
You can mark various points to highlight different places like airports, schools, hotels, hospitals, etc. on the map. Plus, you can also draw lines on a map and create paths among various places.
You can open shapefiles in multiple layers in your project. After adding layers, you can rearrange their order, change their color, vary their transparency, etc. Zoom in and zoom out options are also available. Moreover, you can also zoom into the selected area on the map. Apart from this, you will find three different measurement tools. Using these measurement tools, you can measure the angle, distance between two points/places, and area of the selected region on the map.
Some of the GIS software come with a histogram plot feature. In GIS, a histogram is a graphical representation of various statistical data on earth, like water vegetation, dry soil, etc. One of the software also draws a scatterplot of the statistical data.
My favorite GIS software for Windows:
SAGA is my favorite GIS software. It is an open source GIS software and supports various programming languages, like Python, JAVA, C#, R, etc. It is a lightweight software which comes with a lot of great features, like simulation, cartographic projections and georeferencing, image processing, terrain analysis, etc.
QGIS is my another favorite GIS software. I would suggest it for the beginners as it is easier to understand than other GIS software. Also, there are various video tutorials to understand its working in detail, like QGIS Tutorial Videos.
You may also like some best free Online Voting Websites, Webinar Software, and Resume Building Software for Windows.
SAGA
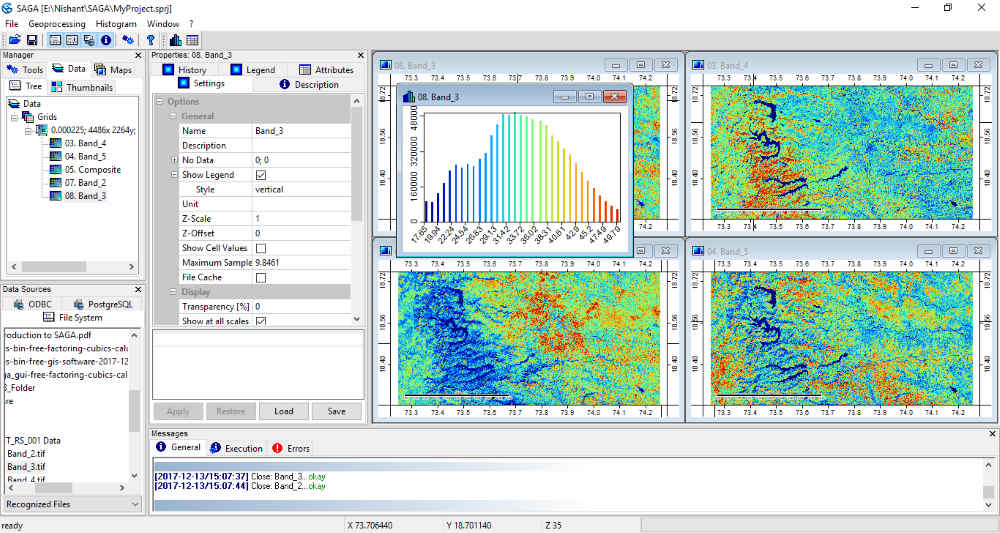
SAGA is an abbreviation for System for Automated Geoscientific Analyses. It is a free and open source GIS software for Windows. It comes with a user-friendly interface and supports both vector and raster file types. Since it is an open source GIS software, you can write batch/shell scripts for automation in its built-in command line interpreter, named SAGA CMD. Moreover, if you are a programmer, then I think there can be no other software better than SAGA for you, as it comes with a SWIG compiler which supports various programming languages, like Python, JAVA, C#, R, etc.
You can add multiple layers/bands to your project. All the layers added to the project are easily accessible in the Maps tab on the left panel of the software. It lets you import shapefiles as various layers from your PC. You can view the properties of each layer. You can arrange the added layers horizontally or vertically. Moreover, any layer can be shown or hidden by right-clicking on it. You can also vary the transparency of a layer which is set to zero by default, turn it into grayscale, invert its colors, etc. You can zoom into/out the selected area on a band.
Do note that SAGA cannot handle multiple bands imagery. This means that viewing different shapes and the land covers is not possible on one band at a time. For this, you have to create a false color composite. A false color composite must be created as a separate image or must overwrite a previous image. For this, go to Geoprocessing > Visualization > Grid > RGB Composite.
This free GIS software also creates a histogram of a band. A histogram is basically a frequency distribution, in which band statistical data such as water vegetation, dry soil, etc. is represented in the form of a graphical pattern. We can use the histogram only for a single band. If there are more than one bands, we have to use Scatterplot. You can zoom into or out of a histogram. As you zoom into a histogram of a selected band, the respective area on the band also gets zoomed. The histogram also shows the arithmetic mean and standard deviation of the band. You can view these details in the description tab.
It also has a measurement tool by which you can measure the distance between any two points on the map.
All in all, SAGA is one of the best GIS software that comes with a lot of features. Some of its great features include: Simulation, Cartographic projections and georeferencing, A number of raster and vector data tools, Image processing, Terrain analysis, Geostatistics, Map view, Notifications, and many more
All in all, SAGA is one of the best GIS software.
QGIS
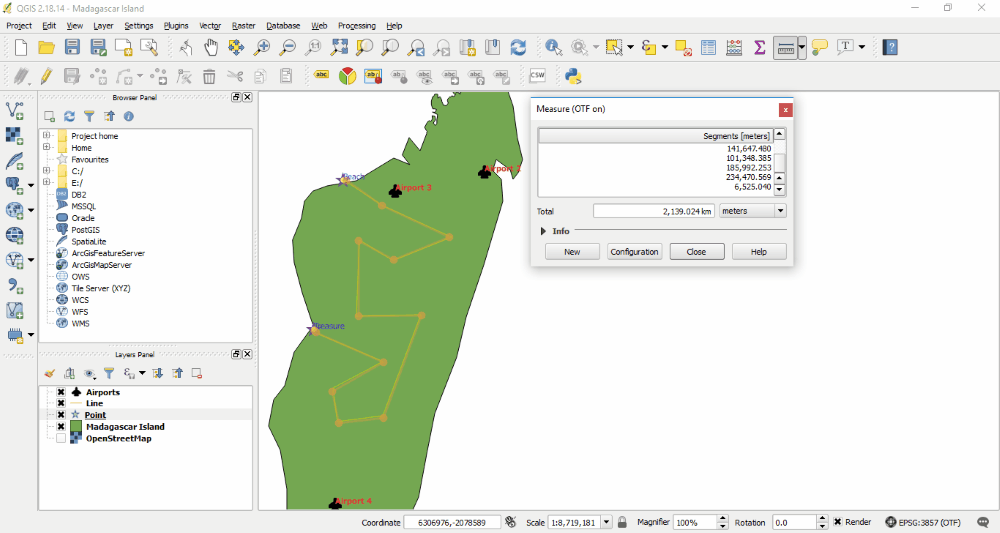
QGIS is an acronym for Quantum Geographic Information System. It is a free GIS software for Windows which lets you manage and analyze the geographical data. You can create multiple layers (blank or import shapefiles) in your project, mark multiple points at different locations on a map and name them, create paths among points, etc. with the help of this free GIS software. After creating your own maps, you can publish them on the internet. The good part of the software is that you can process both vector and raster files in it.
You can change the properties of layers (point layer, line layer, etc.). For example, if you want to highlight airports, restaurants, schools, etc. on the map, you can mark them with different symbols available in the software. Moreover, you can also change the coordinates of points and label them. See the above screenshot in which, I selected the Madagascar island, marked its boundaries, and created my own map by creating a path between any two points, say Beach and Treasure. I also added a point layer on which I highlighted some airports and also labeled them. In this way, you can add more details to your map by creating multiple shape layers in your project.
Apart from the above-listed features, a measurement tool is provided by which you can take the following measurements:
- Measure Line: You can measure the distance between any two points on the map. For this, select the measurement tool from the Tools menu and select any two points on the map with the left click of your mouse. You can select the unit of distance in kilometers, meters, yards, feet, miles, etc.
- Measure Area: This tool lets you measure the area of a particular region on the map. You can view the area in square meters, square kilometers, square feet, square yards, square miles, acres, hectares, etc.
- Measure Angle: This tool is used to measure an angle between two paths. It displays the measured angle in degrees.
Annotation is another good feature of this software. Five types of annotation tools are available, namely, text annotation, form annotation, HTML annotation, SVG annotation, and move annotation.
It comes with a lot of plugins. You can manage and install the plugins from Plugins menu.
After completing your project, you can save it in QGS format. Besides this, you can also save the map in multiple image formats such as BMP, ICO, PNG, JPG, TIFF, etc.
If you are new to QGIS, you can watch this video tutorial for beginners.
DIVA-GIS
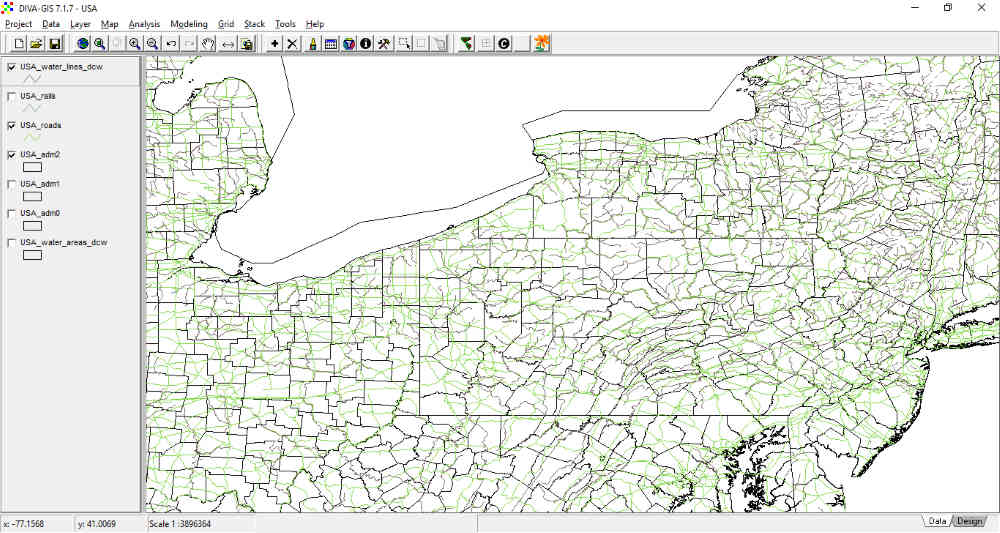
DIVA-GIS is yet another free GIS software for Windows. To begin a project, you need a shapefile. DIVA-GIS provides shapefiles of all countries. You can download and use these shapefiles in your project for free. Besides DIVA-GIS, you can also use these shapefiles in any other GIS software. You can download administrative areas, inland water, roads, railroads, elevation, land cover, land cover (country mask), etc. for each country. As you can see in the above screenshot, I have downloaded the data of the United States of America.
All the shapefiles are opened in new layers automatically and are accessible on the left panel of the software. Like other GIS software in this list, it also lets you add multiple layers to your project. Click on the Plus icon on the toolbar to open a shapefile in your project. You can remove any layer from the map temporarily by unchecking its respective checkbox. Clicking on the cross icon on the toolbar will permanently remove the selected shapefile from your project.
Its basic features include zoom in, zoom out, pan, zoom to full extent, etc. Now, lets checkout some of its interesting tools:
- Climate Tool: It is an additional feature of this software. Using this tool, you can view the climatic conditions of any location on the map by clicking on it. In order to use this feature, you have to download the climate database from its website. The climate database is downloaded in the zip format. Extract it in a folder. This folder is to be set as a default path for the climate data. To do this, go to Tools > Options > Climate and browse that folder.
- Geo Calculator: It lets you convert coordinates in the sexagesimal (degrees, minutes, seconds) system to a decimal system for a particular location or for more than one locations. Besides this, you can also measure the distance on the map with the help of Distance tool.
You can save your project in div format. Moreover, it also has a “Map to Image feature” by which you can save the map in PNG, BMP, and Metafile (EMF) format. Before saving it as an image file, you can also vary its resolution. You can also copy the map to the clipboard.
Click here to download the manual of DIVA-GIS.
Whitebox GAT
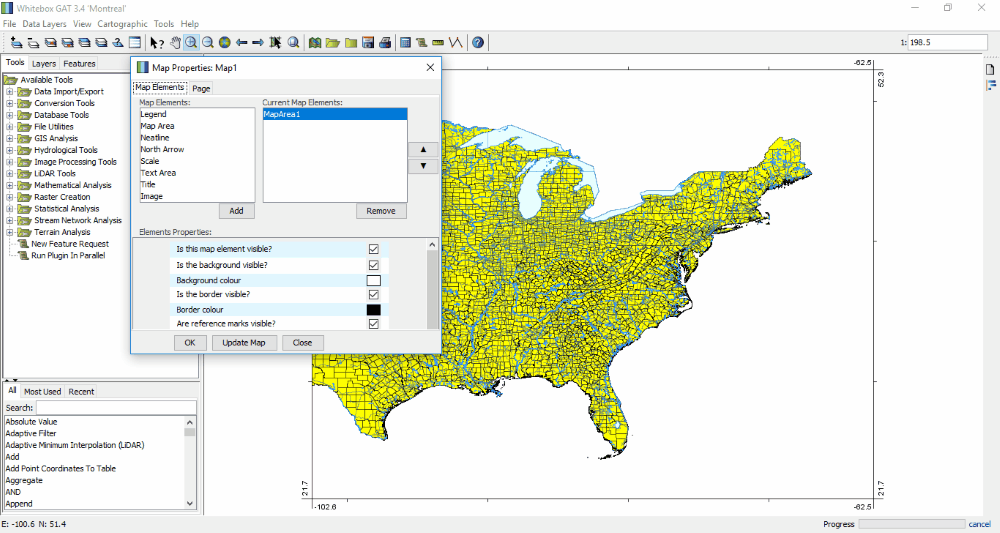
Whitebox GAT is another free GIS software for Windows. You can import shapefiles in multiple layers into the software by clicking on Plus icon on the toolbar. You can either delete a layer permanently or remove it temporarily by unchecking its respective box. After placing the layers, if any layer hides another layer on the map, you can change its position in the Layers tab, so that the hidden layer becomes visible. If you do not want to change the position of layers, you can vary its opacity. Right-click on any layer to view/change its properties, like layer visibility, line color, line thickness, line style, layer opacity, fill color, etc. Moreover, you can also zoom in or zoom out a particular selected area on the map.
It also has an option to export a layer in two formats: Geography Markup Language (GML) and Well-Known Text Files (wkt). Apart from this, you can also export the map as an image in various formats, like JPG, BMP, GIF, PNG, etc. The entire map can be saved in whitebox map files (wmap) format. Plus, you can also take a print of the map.
Though it supports vector and raster data layers, Histogram feature is available only for raster data layers.
In the Map Properties, you can add various elements to the map, like legend, map area, north arrow, scale, neatline, etc. In addition to this, you can also change the background color of map, toggle the visibility of its border, toggle the visibility of background, change its dimensions, etc. You can also change the page orientation as landscape or portrait and change the paper type (letter, legal, A0, A1, A2, A3, A4, A5, A6, A7, B0, B1, etc.).
Whitebox GAT is one of the best GIS software which comes with more than 410 analysis tools and lets developers create and add custom tools or plugins using any JVM language. It also comes with a measurement tool.
TerraView

TerraView is yet another free GIS software for Windows. You can add vector layers, raster layers, and raw raster layers in your project. In order to add layers, right click on the Layer Explorer section on the interface and select Add Layer option. After adding all the layers, right click on the empty workspace and select Draw option to draw a map. If you add more layers or remove the existing ones, you have to click Draw option again in order to apply the changes. You can remove any layer temporarily by unchecking its respective box or permanently selecting Remove Item(s) option.
It also plots a Histogram of a selected layer. Before plotting a histogram, you can select the properties of the histogram as FID, ISO, COUNTRY, and F_CODE_DES. If you select the FID histogram, you can set the number of slices. Press and hold the left click of your mouse and drag it to select an area on the FID histogram, you will see that area is also highlighted on the map.
This free GIS software also has several processing tools which include vector processing, raster processing, spatial processing, DTM processing, etc. It also has angle, area, and distance measurement tools. Out of these measurement tools, only angle measurement tool worked well during testing.
You can save the project in its own supported (tview) format. Besides this, you can also export a layer in shapefile format.
MapWindow
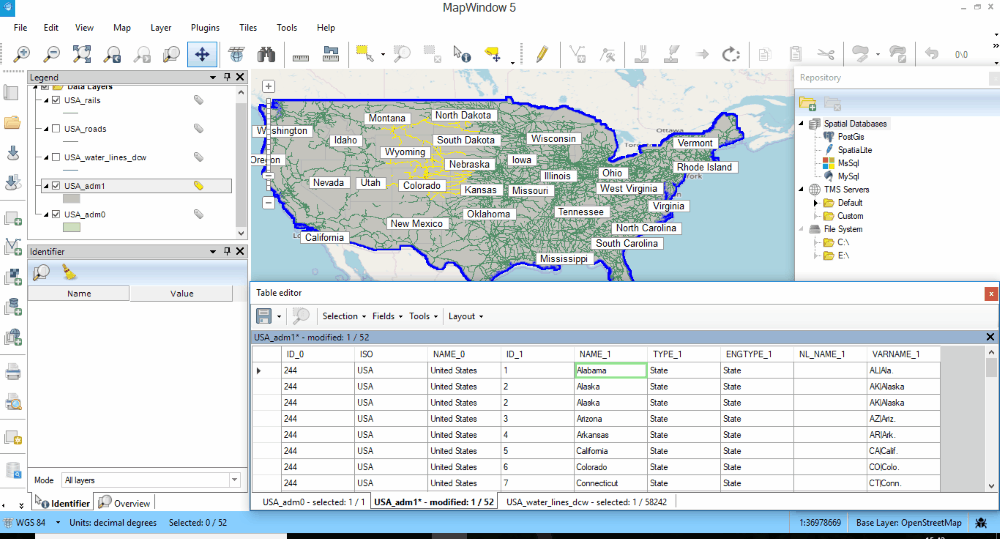
MapWindow is another free and open source GIS software for Windows. The add layer option is available in the File menu. You can add many layers to your project and make any of them inactive temporarily by unchecking their respective boxes. Besides this, you can also add vector, raster, database, and wms layers to your project. You can zoom into or zoom out of the map either by scrolling the mouse or by using the zooming tools on the toolbar. All the layers are available on the left side of the software.
You can edit the layers with the help of Edit Layer tool. This tool lets you add geometry to the map.
Find Location: Using this tool, you can easily search any state/city on the map by typing its name in the search bar. Besides this, you can also add labels to the map and make the layers transparent.
The Area Measurement tool lets you measure the area of the selected region on the map. Simply select the tool and start placing points one by one on the map in order to draw a shaded region. Double click on the map to mark the final point. It displays the total area in the center of the shaded region. The Measure Distance tool lets you measure the distance between two points on the map by drawing lines. The area is displayed in square kilometer and the distance is displayed in kilometer. I did not find any option to change the unit of measurement.
In the Tools menu, you will find different display styles for the map. For example, open street map, open transport map, open cycle map, bing maps, etc. Some of these maps require API key. Moreover, there is also an option to configure the maps. You can change the mouse wheel direction for zoom in and zoom out, change the unit of display coordinates as degrees or map units, change the style of scale bar as google style, American, or metric, etc. Besides this, you can also set the map scale.
OrbisGIS
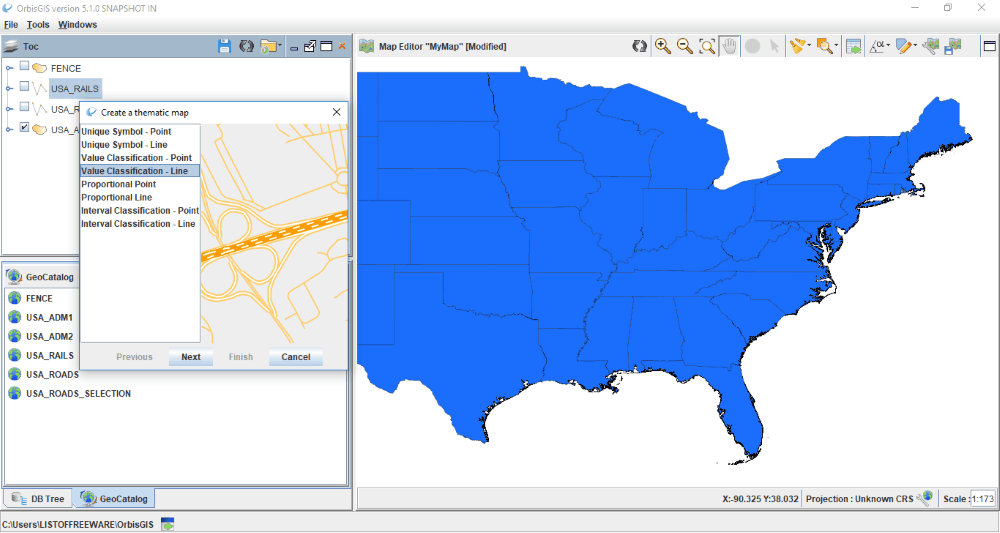
OrbisGIS is another free GIS software for Windows. All the shapefiles are added in the GeoCatalog window. To add shapefiles, right-click in GeoCatalog window and select import option. After adding shapefiles, drag them one by one in the Toc window in order to create the map on the workspace, named Map Editor here. For every layer, you can create a thematic map. You can choose from the following thematic maps:
- Unique Symbol – Point
- Unique Symbol – Line
- Value Classification – Point
- Value Classification – Line
- Proportional Point
- Proportional Line
- Interval Classification – Point
- Interval Classification – Line
Zoom in and zoom out options are available. You can zoom into a particular selected area of the map. You can also draw a fence (boundary) on the map. Besides this, a measurement tool lets you measure the distance, area, perimeter, and angle. I do not know which unit is used in this software to measure length, perimeter, and area, as it does not display the unit of measurement.
When you are done, you can export the map in PNG, TIFF, JPG, and PDF formats.
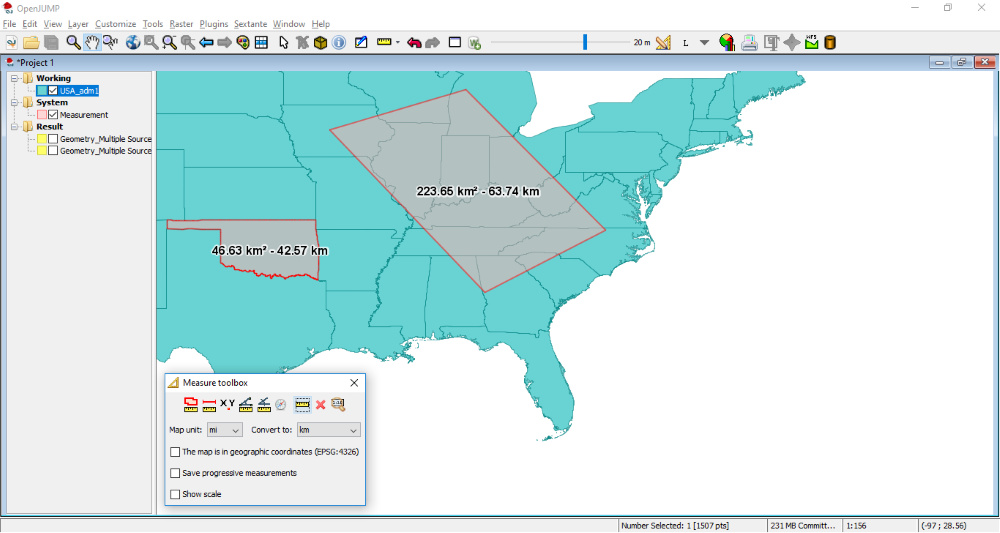
OpenJUMP
OpenJUMP is another free GIS software for Windows. You can open and edit any shapefile in this freeware. After opening a shapefile, you can create a detailed map on your own. You can also create a map on the empty workspace with the help of available tools.
Editing Tools: Various editing tools are available in this free GIS software. You will find the editing tools in the Editing Toolbox in the Tools menu. Some of the editing tools are given below:
- Rectangle tool: It lets you draw rectangles on the map.
- Polygon tool: It helps you draw polygons on the workspace.
- Point tool: You can mark various points on the map using this tool.
- Draw Linestring: It lets you draw lines on the workspace. This tool is helpful in joining various points to one another on the map.
- Split Lines: You can split lines using this tool. This tool is helpful if you want to select different parts of the same line.
- Notes: You can write some text on your project using this tool.
There is also a CAD tool which lets you draw different geometric shapes on the map. These shapes include ellipse, circle, parallelogram, concyclic polygon, arc, etc. Different figures can be drawn by selecting different parameters. For example, you can draw a circle by radius, tangent, diameter, or simply by marking three points on the workspace.
Its measurement tool lets you measure distance, area, angle, coordinates, azimuth, etc on the map. You can also change the units of measurement as meter, kilometer, yards, feets, miles, etc.
Measure Selected Features is a very useful tool of this software. Using this tool, you can measure the area of a region on the map, say any state in just a click. Click on the above screenshot to understand the difference between a simple area measurement tool and Measure Selected Features tool. Measure Selected Features tool automatically detects the area of a state on the map in a single click and displays its area. On the other hand, if you are using simple area measurement tool, you have to draw a shaded region on the map to measure its area.
When you are done, you can save the project in jmp and jcs formats. Besides this, you can also save the map view in png and jpg image formats.


About Us

We are the team behind some of the most popular tech blogs, like: I LoveFree Software and Windows 8 Freeware.
More About UsArchives
- May 2024
- April 2024
- March 2024
- February 2024
- January 2024
- December 2023
- November 2023
- October 2023
- September 2023
- August 2023
- July 2023
- June 2023
- May 2023
- April 2023
- March 2023
- February 2023
- January 2023
- December 2022
- November 2022
- October 2022
- September 2022
- August 2022
- July 2022
- June 2022
- May 2022
- April 2022
- March 2022
- February 2022
- January 2022
- December 2021
- November 2021
- October 2021
- September 2021
- August 2021
- July 2021
- June 2021
- May 2021
- April 2021
- March 2021
- February 2021
- January 2021
- December 2020
- November 2020
- October 2020
- September 2020
- August 2020
- July 2020
- June 2020
- May 2020
- April 2020
- March 2020
- February 2020
- January 2020
- December 2019
- November 2019
- October 2019
- September 2019
- August 2019
- July 2019
- June 2019
- May 2019
- April 2019
- March 2019
- February 2019
- January 2019
- December 2018
- November 2018
- October 2018
- September 2018
- August 2018
- July 2018
- June 2018
- May 2018
- April 2018
- March 2018
- February 2018
- January 2018
- December 2017
- November 2017
- October 2017
- September 2017
- August 2017
- July 2017
- June 2017
- May 2017
- April 2017
- March 2017
- February 2017
- January 2017
- December 2016
- November 2016
- October 2016
- September 2016
- August 2016
- July 2016
- June 2016
- May 2016
- April 2016
- March 2016
- February 2016
- January 2016
- December 2015
- November 2015
- October 2015
- September 2015
- August 2015
- July 2015
- June 2015
- May 2015
- April 2015
- March 2015
- February 2015
- January 2015
- December 2014
- November 2014
- October 2014
- September 2014
- August 2014
- July 2014
- June 2014
- May 2014
- April 2014
- March 2014
