12 Best Free Noise Meter Software For Windows
Here is the list of Best Free Noise Meter Software for Windows. These software let you analyze environmental noise around you. By analysis, I mean, you can view real time information of noise around you. Frequency, intensity (dB), and spectrum of audio input can be viewed using these noise meter software. And all of this can be done with the help of a microphone connected to your PC.
Using these noise meter software, you can not only analyze real time audio input, but can also analyze audio files stored on your computer. Most of these noise meter software are different from each other in many ways. Some let you analyze real time audio input, some let you record audio to analyze, some record the audio analysis data, some display real time dB and frequency values, and some let you analyze spectrum of audio input. One of the noise meter software has been developed to help teachers maintain silence in classrooms by recording noise data.
Go through the list to find out more about these best free software to measure noise. You will also get to know how to measure noise on your computer using these software.
My Favorite Noise Meter Software:
I cannot reach a conclusion as to which is my favorite software out of these. All of the mentioned software have distinct utility and can be used according to the need.
You can also checkout the list of best free Audio Normalizer Software and Audio Noise Reduction Software.
Noise Meter Tool
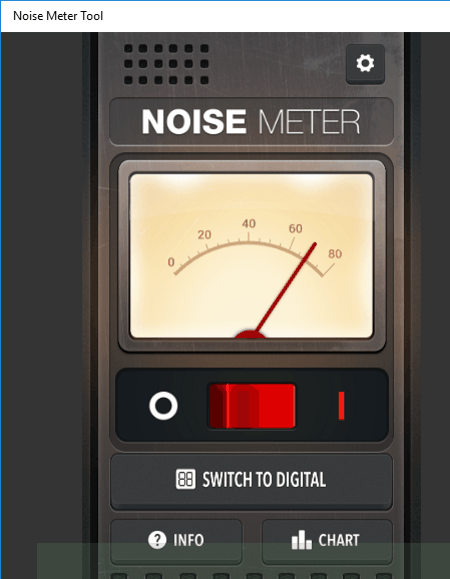
Noise Meter Tool is a simple yet amazing noise meter software. Actually it is a Windows 10 app that can be downloaded from Windows App Store. It detects sound with the help of any external microphone connected to your PC. After that, the noise level is displayed in either digital or analog form. It detects and displays noise from a range of 0 to 80 dB. A chart displays the noise level over a given period of time. Also, with the help of Info menu, you can view what different noise dB levels denote, such as: 10 db is wrist watch ticking sound, 20 dB is whisper sound, 60 db is regular conversation sound, etc.
Its a very simple app to measure noise, which displays noise intensity in dB. You will not find any advanced option, but its a must have if you just want to measure noise of your surroundings.
Autocord
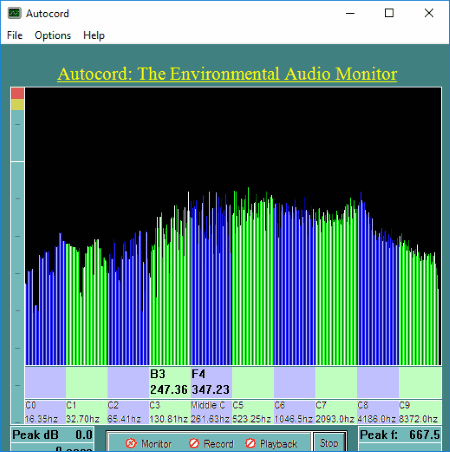
Autocord is an easy to use noise meter software, that you can use to analyze environmental audio. This software lets you record environmental audio for analysis. You can also carry out a real time analysis of environmental sound. After analysis of sound, peak dB level and peak frequency level are displayed. You will also view the sound spectrum of the audio being analyzed.
The recorded sound clips are saved on your PC. To analyze the recorded sound, click on the Playback option, select the audio file, and begin the analysis. To analyze real time sound, simply click on the Monitor option and begin analysis.
Zero Noise Classroom
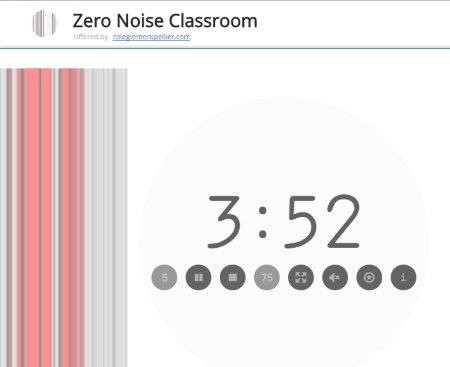
Zero Noise Classroom is a Chrome Extension to measure noise. It has been developed as an assistant for class teachers to maintain silence in classrooms. When activated, it detects sound with the help of your PC’s mic and records noise activity. It can detect noise from a range of 10 to 98 dB.
It actually records noise activity for a given period of time when started. It can record noise for upto 60 minutes. The representation of noise is displayed in bars with respect to time. As the noise intensity increases, the bars turn Red in color. You can clearly see in the above picture, that bars are red for the time there was noise, and grey when less noise was detected. Also the noise percentage is displayed once noise detection is stopped.
So, by using this noise meter software, teachers can know if there was noise in the classroom in their absence.
Noise Meter
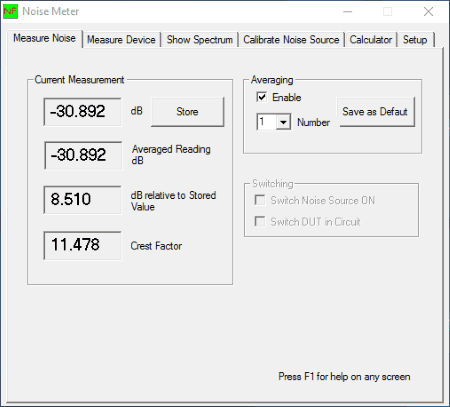
Noise Meter is a free noise meter software for Windows. It uses microphone connected to your PC to detect noise. It not only displays the value of noise in real time, but also displays noise spectrum in the form of waveform. There are various other features of this noise meter software which are worth a note.
You will find the tools offered by this software under various tabs. These tabs and the tools available in them are:
- Measure Noise: In this tab, you can view the current value of noise in dB, average reading in dB, dB related to stored value, and Crest Factor.
- Show Spectrum: Here you can view the sound wave spectrum on a dB vs KHz graph.
- Calibrate Noise Source: You get to measure reference noise source and you can even automate dummy noise readings.
- Setup: Here you can select the device that you want to use to capture noise. Set frequency, set duration to capture noise, set automation port, etc.
This is one of the best software out there to measure noise.
Peak Programme Meter
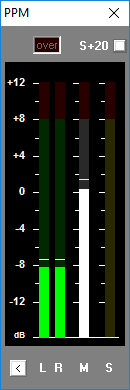
Peak Programme Meter reads audio input in real time and marks the peak noise level. The scale range of this noise meter software is -12 dB to +12 dB. The detected sound is displayed in 3 channel bars; one for left channel, other for right channel, and one for median of both channels.
As you start this tool, it begins detecting the sound input and keeps highlighting the peak noise levels for each channel.
This noise meter software is suitable for those who want to find out peak sound level while analyzing an audio input in real time.
Euterpe Free
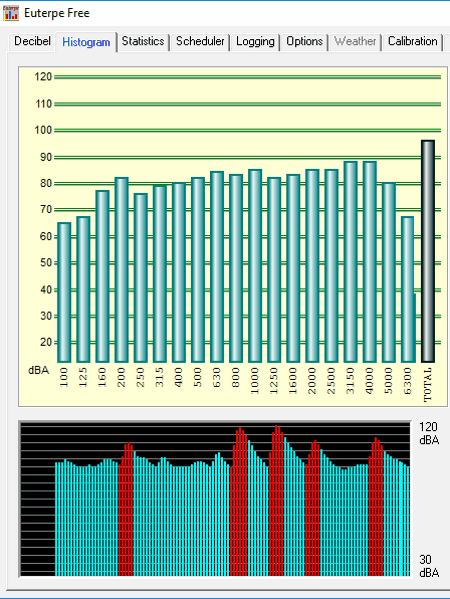
Euterpe Free is a free sound meter software that can be used to measure noise. It captures sound and displays information such as Frequency (Hz), LF (A), LF (lin), histogram in a dB vs time graph, etc. It can detect and display upto 120 dBA noise. If the noise reaches alarming level 110dBA+ the histogram bar becomes red. This way you will know when the noise is too much.
There are various tabs that provide sound and noise measurement related tools. For example, the Statistics tab has tools to show noise value after given interval of time. Here, you can view values as A-weighted or Unweighted. The Scheduler tab lets you schedule a time to test noise level and repeat the scheduling.
If you have multiple audio input devices connected, you can select the device that you want to use with this software.
Its an advanced free noise meter software that can be used to measure various sound input parameters.
Orban Loudness Meter
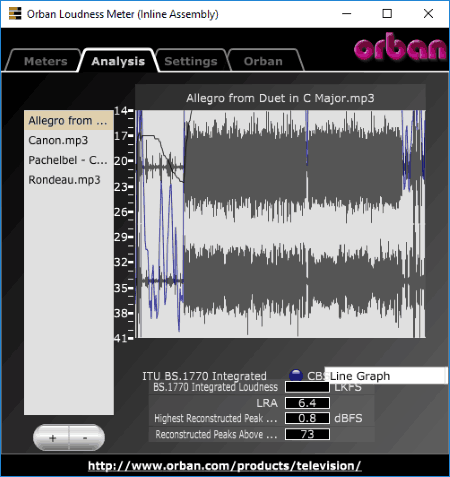
Orban Loudness Meter is a simple noise meter software for Windows and Mac OS. Using this software, you can find out levels of CBS, ITU, VU, PPM, and Reconstructed Peak levels of audio input. You will have to connect a device with mic to your PC to detect sound. You can measure loudness levels of sound being played live. You can analyse stereo, 5.1 surround, and 7.1 surround audio input with this tool.
The maximum and minimum level values of the above mentioned sound parameters are:
- CBS: -41 db to -14 db.
- ITU: -41 LKFS to -14 LKFS.
- VU: -30 dbfs to +5 dbfs.
- PPM: -30 dbfs to +5 dbfs.
- Reconstructed Peak: -30 dbfs to +5 dbfs.
You can not only analyze audio of audio files, but also analyze audio of video files using this software. The following commonly used file formats can be analyzed using Orban Loudness Meter: mp3, wav, aiff, flac, wma, mp4, mov, aac, etc. In the Analysis tab, you can view the waveform of the audio file. Here you will also view BS.1770 Integrated Loudness, LRA, Highest Reconstructed Peak Level, and Reconstructed Peaks Above 0 dBFS.
The Settings menu of this software lets you add audio device to analyze live audio, set parameters for CBS, ITU, PPM, and VU, Set loudness alarm level, set peak alarm level, and more.
WinScope
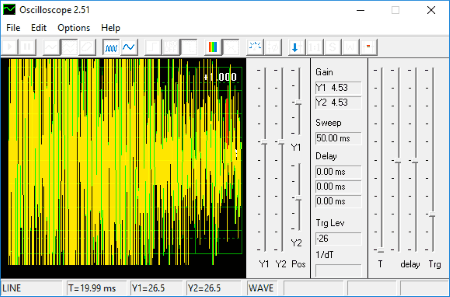
WinScope is a digital oscilloscope software which can be used to measure noise. Use your PC’s mic as input device to this software and you can view real time audio analysis on the interface of this software. The sound input will be displayed in form of bars according to the intensity. Using this software, you can measure frequency and even save the recorded data as .dat file.
The tools available in this software let you plot single line trace, dual line trace, set time division (5ms /0.5ms), etc.
This oscilloscope software can be used for extensive purposes and to examine different forms of signals apart from sound.
Real-time Spectrum
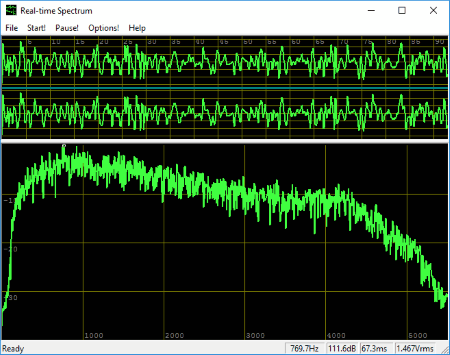
Real-time Spectrum, as the name suggests, displays real time waveform of the audio input fed to it. You can use this software to measure noise pretty easily. You just have to set the microphone of your PC as the input device of this tool. As soon as you start the meter, the spectrum is displayed on its GUI.
Talking about the tech specifications of this noise meter software, the frequency range it can detect is 5512-11025 Hz, and the dynamic range for audio input is 10-100 dB.
You can choose to view 2 channel spectrum, right spectrum, or left spectrum. Also the spectrum display options are: Spectrum, Cepstrum, Smoothed Spectrum, Fileterbank, etc.
Spectrogram
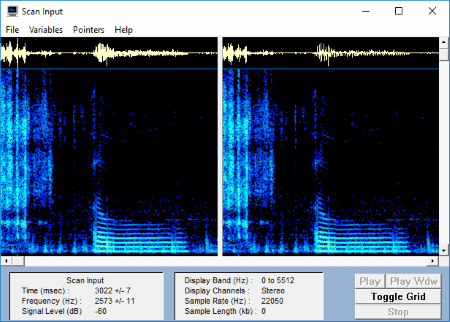
Spectrogram is a software for real time visualization and analysis of audio input. You can use this as a noise meter software by connecting it with your PC’s mic. As you begin the analysis, you will be able to view dual channel noise output as spectrum and values of frequency (Hz) and signal level (dB).
You can also analyze an audio file stored on your PC in WAV format.
The output graph scale can be changed. You can set the frequency scale to linear, log, or Oct/3. FFT size can be chosen from 512, 1024, 2028, 4046, 8192, or 16384.
Note: The newer version of this software is not free. Only the version 5.17 is free, which is an older version. You will find the download link on the homepage.
Audio Spectrum Analyser
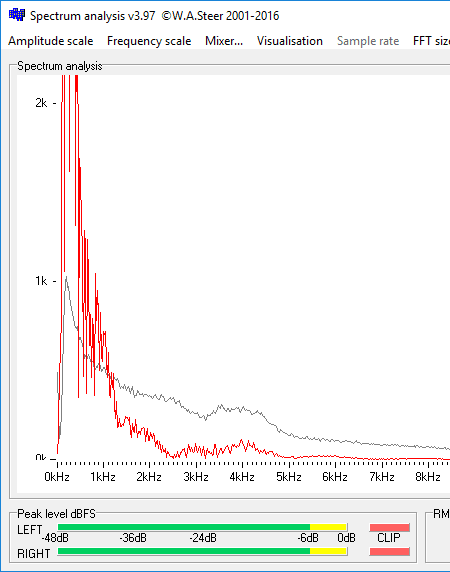
Audio Spectrum Analyser lets you view audio input spectrum in real time. The uniqueness of this software is that it lets you view audio spectrum on different graphs scales. Begin the noise meter by selecting the audio input device and then Start the monitor. Real time spectrum is displayed on a graph of Amplitude vs Frequency. The graph scale and visualization can be changed to get output according to your choice.
The Amplitude scaling options are: linear scale, 100 dB logarithmic, 135 dB logarithmic, and square root compressed. The Frequency scaling options are: normal, stretched, and logarithmic. You can choose from the following visualization options to view the graph: spectrograph, spectograph with average (it displays average value of sound input), spectrogram (horizontal/vertical), and 1/3 octive band. Another interesting option lets you set FFT size from 1028, 2048, or 4096.
This noise meter software is totally an audio spectrum based tool to view noise levels in real time.
VA (Visual Analyzer)
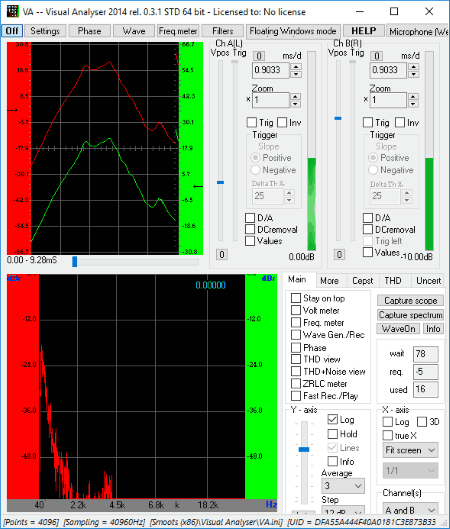
VA or Visual Analyzer is another free oscilloscope software that can be used as a noise meter software. It pretty advanced oscilloscope and has more advanced tools and functions than WinScope. To use it as a noise meter software, all you need to do is set your computer’s mic as audio input device. You can easily analyze and view the frequency and dB value of real time audio input from your mic. Apart from this, there are numerous other tools that you can make use of.
The frequency and dB monitors are not straightforwardly displayed on the interface. The interface can be a complex to understand for a newbie. To view the frequency readings, click on the frequency monitor button. This opens a small window, which displays frequency of audio input in real time. You can set frequency resolution and % power of peak while analyzing frequency. The dB meter is available on the main interface. The panels on the right side have dB meters for both Left and Right channels.
As I said, its an advanced oscilloscope software with tonnes of options and can be used for multiple digital signal analysis processes.
Harshwardhan Gupta
https://padangtoto-online.s3.wasabisys.com/index.html https://padangtoto.s3.us-west-004.backblazeb2.com/index.html
About Us
We are the team behind some of the most popular tech blogs, like: I LoveFree Software and Windows 8 Freeware.
More About UsArchives
- May 2024
- April 2024
- March 2024
- February 2024
- January 2024
- December 2023
- November 2023
- October 2023
- September 2023
- August 2023
- July 2023
- June 2023
- May 2023
- April 2023
- March 2023
- February 2023
- January 2023
- December 2022
- November 2022
- October 2022
- September 2022
- August 2022
- July 2022
- June 2022
- May 2022
- April 2022
- March 2022
- February 2022
- January 2022
- December 2021
- November 2021
- October 2021
- September 2021
- August 2021
- July 2021
- June 2021
- May 2021
- April 2021
- March 2021
- February 2021
- January 2021
- December 2020
- November 2020
- October 2020
- September 2020
- August 2020
- July 2020
- June 2020
- May 2020
- April 2020
- March 2020
- February 2020
- January 2020
- December 2019
- November 2019
- October 2019
- September 2019
- August 2019
- July 2019
- June 2019
- May 2019
- April 2019
- March 2019
- February 2019
- January 2019
- December 2018
- November 2018
- October 2018
- September 2018
- August 2018
- July 2018
- June 2018
- May 2018
- April 2018
- March 2018
- February 2018
- January 2018
- December 2017
- November 2017
- October 2017
- September 2017
- August 2017
- July 2017
- June 2017
- May 2017
- April 2017
- March 2017
- February 2017
- January 2017
- December 2016
- November 2016
- October 2016
- September 2016
- August 2016
- July 2016
- June 2016
- May 2016
- April 2016
- March 2016
- February 2016
- January 2016
- December 2015
- November 2015
- October 2015
- September 2015
- August 2015
- July 2015
- June 2015
- May 2015
- April 2015
- March 2015
- February 2015
- January 2015
- December 2014
- November 2014
- October 2014
- September 2014
- August 2014
- July 2014
- June 2014
- May 2014
- April 2014
- March 2014
