4 Best Free Open Source Gantt Chart Software For Windows
Here is a list of best free open source Gantt Chart software for Windows. These software are similar to standard Gantt chart software through which you can create Gantt charts to visualize the status of your projects. But, all of these software are free and open source, thus you can download and edit their source codes without any restriction.
In a Gantt chart, you can view multiple horizontal bars over a timeline highlighting the allocated time of projects and tasks. Besides this, horizontal bars also highlights future projects and tasks. Now, to create a Gantt chart, first, you need to create a project. After that, you need to add resources and dependencies to these software. You can then start adding tasks by specifying the task name, task time period, resources that it needs, etc. According to the added task properties, you can view a horizontal bar highlighting the schedule of the task. Similarly, you can add more tasks to complete the Gantt chart. To help out novice users, I have included the necessary Gantt chart creation steps in the description of each software.
After creating a Gantt chart, you can save it in PDF, HTML, XML, etc., formats. In these software, you also get various additional tools that may come in handy. Through additional tools, you can perform variance analysis, collaborate with other users, create resource breakdown structures, etc. Go through the list to know more about these software.
My Favorite Open Source Gantt Chart Software For Windows:
GanttProject is my favorite software because it offers all the essential tools to create a functional Gantt chart. Plus, it is also quite simple to use.
You can also check out lists of best free Gantt Chart, Project Management With Gantt Chart, and Bar Chart Maker software for Windows.
GanttProject
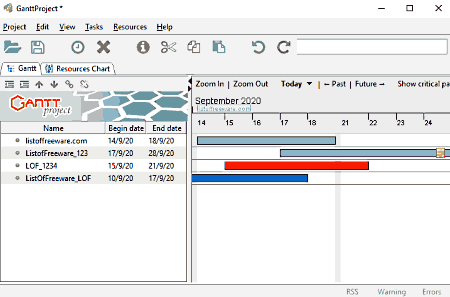
GanttProject is a free open source Gantt chart software for Windows, Linux, and macOS. Through this software, you can create Gantt charts to track and manage project timelines. It also lets you track all the tasks that come under a project using a Gantt chart. I also like its ability to schedule tasks. Apart from the Gantt chart, it also lets you create PERT charts to visualize tasks and their time slots for different projects. Now, follow the below steps to create a Gantt chart using this open-source Gantt chart software.
How to create Gantt Chart chart using GanttProject:
- Launch this software and go to the Project tab and select the New option to start a new project.
- After that, specify the name of project and its domain like software development.
- Now, press Next and configure weekends and public holidays and press OK.
- After that, go to the Resource Chart tab to add all the resources that you need for a project like employees, managers, hardware, etc.
- Now, move to the Gantt tab and add project tasks.
- After adding all the tasks, go to task properties to specify task timeline, task priority, and resources that a task need.
- According to the number of tasks and their duration, you can view your Gantt chart containing multiple horizontal bars over the timeline area.
The final Gantt chart can be saved in PNG, JPG, PDF, CSS, and HTML formats.
Additional Features:
- Collaboration: Using this feature you can collaborate with other users. Although, you need your own cloud storage or WebDAV servers to establish connections with other users.
Final Thoughts:
It is a feature-rich open source Gantt Chart software through which you can easily create Gantt charts to schedule, manage, and visualize projects.
ProjectLibre
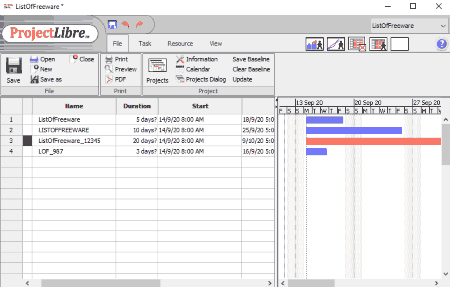
ProjectLibre is another free open source Gantt chart software for Windows, macOS, BSD, Solaris, and Linux. Through this software, you can easily create Gantt charts to plan and schedule projects & tasks. It also helps you track the start and end times of projects. Apart from creating a new project, you can also import existing Microsoft Project files to create their Gantt charts. Now, follow the below steps to create Gantt chart using this open source Gantt chart software.
How to create Gantt chart using Project Libre:
- Launch this software and create a New project by going to the File menu.
- After that, specify the name and date of a project and press OK.
- Now, move to the Resources tab to add all the resources needed by your project.
- Next, move to the Task section and start adding tasks one by one along with the duration of each task.
- Now, add the names of resources that a task needs in the Resources Name column.
- After adding all the resources, you can view the Gantt chart containing horizontal bars on the right panel highlighting the duration, starting time, and ending time of each task.
You can save all the project information along with Gantt chart in XML and PDF formats.
Additional Features:
- Charts: This software also lets you generate various charts to highlight task usage, resource usage, actual work, baseline work, etc.
Final Thoughts:
It is another capable open source Gantt chart software through which you easily create Gantt charts for projects and tasks.
Open Workbench
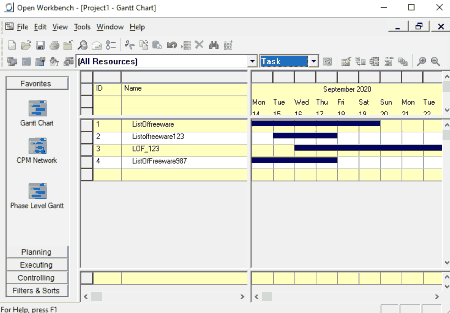
Open Workbench is yet another free open source Gantt chart software for Windows. Using this software, you can create Gantt charts to schedule projects, manage projects, specify task timelines, etc. This software also offers tools to check dependency status, revise the schedule, and perform variance analysis, etc. Now, follow the below steps to create a Gantt chart using this open source Gantt chart software.
How to create Gantt chart using Open Workbench:
- Start this software and create a New project by pressing the New button.
- After that, go to the Planning section and use Resource Assessment and Dependency Definition sub-sections to add resources and dependencies that your project may need.
- Next, move to the Favorites section and select the Gantt chart option.
- Now, right-click over an empty row and select the Modify option to specify task name, task timeline, etc.
- After that, select what resources and dependency a task needs and press OK.
- Similarly, you can add more tasks. According to the added tasks, a Gantt chart will appear on the right-side panel that you can save in XML format.
Additional Features:
- Controlling: Using this section, you can revise the schedule, perform variance analysis, and mark timeslots over the Gantt chart as unused availability.
- Filter and Sorts: Using it, you can filter out tasks and projects using custom-built filters. Plus, a sort feature to sort the projects according to their resources is also present in it.
Final Thoughts:
It is another good open source Gantt chart software through which you can create Gantt charts to visualize project timeline, task schedule, etc.
OpenProj
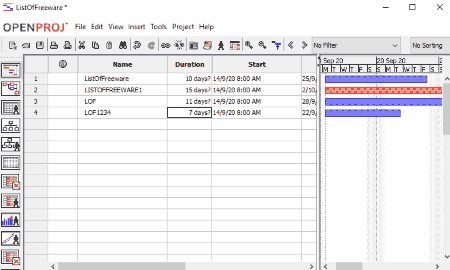
OpenProj is one more free open source Gantt chart for Windows. This software is almost similar to ProjectLibre through which you can create Gantt charts to visualize and manage project timelines, task timelines, etc. Apart from the Gantt chart, it can also be used to create resource breakdown and work breakdown structures to visualize the workflow of projects. Now, check out the below steps.
How to create Gantt Chart using OpenProj:
- Launch this software and go to File > New option to create a new project.
- After that, specify the name of the project, project start date, and project manager name.
- Now, go to View > Resources to add resources by specifying their name, resource type (material or work), material label, etc.
- After that, move to Gantt Chart and specify the task name, task duration, resources that a task need, etc. Similarly, you can add more tasks to create a complete schedule of all the tasks of a project.
- According to the added tasks, you can view multiple horizontal bars of Gantt chart on the right panel.
Additional Features:
- Network: Using it, you can connect tasks that are going to use the same resources over different periods of time to highlight workflow and resource shift from one task to another.
- WBS and RBS: Through these sections, you can create resource breakdown and work breakdown structures.
Limitation:
- This software doesn’t let you save the Gantt chart in PDF format. To remove this limitation, you need to purchase its premium version.
Final Thoughts:
It is a capable open source Gantt chart that anyone can use to create Gantt charts for projects and tasks.


Naveen Kushwaha
Passionate about tech and science, always look for new tech solutions that can help me and others.
About Us

We are the team behind some of the most popular tech blogs, like: I LoveFree Software and Windows 8 Freeware.
More About UsArchives
- May 2024
- April 2024
- March 2024
- February 2024
- January 2024
- December 2023
- November 2023
- October 2023
- September 2023
- August 2023
- July 2023
- June 2023
- May 2023
- April 2023
- March 2023
- February 2023
- January 2023
- December 2022
- November 2022
- October 2022
- September 2022
- August 2022
- July 2022
- June 2022
- May 2022
- April 2022
- March 2022
- February 2022
- January 2022
- December 2021
- November 2021
- October 2021
- September 2021
- August 2021
- July 2021
- June 2021
- May 2021
- April 2021
- March 2021
- February 2021
- January 2021
- December 2020
- November 2020
- October 2020
- September 2020
- August 2020
- July 2020
- June 2020
- May 2020
- April 2020
- March 2020
- February 2020
- January 2020
- December 2019
- November 2019
- October 2019
- September 2019
- August 2019
- July 2019
- June 2019
- May 2019
- April 2019
- March 2019
- February 2019
- January 2019
- December 2018
- November 2018
- October 2018
- September 2018
- August 2018
- July 2018
- June 2018
- May 2018
- April 2018
- March 2018
- February 2018
- January 2018
- December 2017
- November 2017
- October 2017
- September 2017
- August 2017
- July 2017
- June 2017
- May 2017
- April 2017
- March 2017
- February 2017
- January 2017
- December 2016
- November 2016
- October 2016
- September 2016
- August 2016
- July 2016
- June 2016
- May 2016
- April 2016
- March 2016
- February 2016
- January 2016
- December 2015
- November 2015
- October 2015
- September 2015
- August 2015
- July 2015
- June 2015
- May 2015
- April 2015
- March 2015
- February 2015
- January 2015
- December 2014
- November 2014
- October 2014
- September 2014
- August 2014
- July 2014
- June 2014
- May 2014
- April 2014
- March 2014
