6 Best Free Open Source GIS Software For Windows
Here is a list of best free open source GIS software for Windows. These open source software are completely free and allow source code editing without any restrictions. With the use of these software, you can create, capture, store, manipulate, analyze, and manage geographic data. There are many fields in which these software serve their purposes such as Weather, Archeology, Architecture, Banking, Aviation, and more.
To analyze and manipulate GIS data, you first need to import GIS data files like Shapefiles, GeoJSON, MapInfo, GML, KML, etc. These files contains both vector and raster data to represent different information about a geographic location. According to the loaded data, you can view a map along with various layers showing roads, heatmaps, population, weather, and more information. Now, to manipulate or analyze the loaded data, these software provide various tools like Layer Tools, Vector Tools, Editing Tools, Insert Layers, etc. Plus, some standard but important viewing tools, like Zoom and Pan, are also present in all software. After analysis, you can save the GIS data in SHP, XML, CSV, KML, and more formats.
Apart from the main analysis and editing tools, you can find many additional tools and features in each of these software. For novice users, these software can be a little complex to operate. Still, all important analysis and editing features are quite simple in most software. Go through the list to find your favorite open source GIS software.
My Favorite Open Source GIS Software For Windows:
QGIS is my favorite software because it provides all essential vector and raster GIS analysis tools. Plus, it is also quite easy to add and edit GIS data layers using it. I also like its ability to support a lot of GIS data file formats.
You can also check out lists of best free GIS Data Viewer, GIS Software, and Geotagging Software for Windows.
QGIS
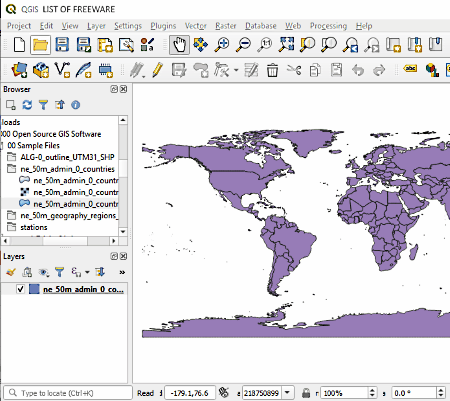
QGIS is a free open source GIS software for Windows. It is one of the best free open source GIS software through which you can view, create, edit, analyze, and save GIS data. In it, you can input GIS data of various types like spatial data, maps, coordinates, geolocation, etc. Plus, you can also load GIS data files of various formats to this software such as SHP, GML, DBF, TXT, CSV, GDB, and more. Using its internal file explorer, you can easily load GIS data to this software. According to the loaded data, you can view maps, pointers, road maps, heatmap, etc., on the main interface of this software. To analyze and edit loaded data, you get various tabs namely Vector, Raster, Layer, and Edit.
Let’s take a look at all available tabs and their features:
- Vector: Using this tab, you can view, edit and analyze vector data like points, lines, polygons, etc. which represent roads, population density, drought-affected areas, etc. Some of the analysis tools which you get in this tab are Mean Coordinate, Line Intersection, Distance matrix, Sum Line Length, etc.
- Raster: Using it, you can analyze and edit visual data such as satellite images, photographs, elevation surface, etc. To perform analysis, you get tools like Grill, Hillshade, Near Black, Roughness, etc.
- Layer: It is one of the important tools through which you can create multiple layers, import existing shapefile layer in your project, mark multiple points at different locations on a map, name points, create paths among points, etc. To perform these operations, it contains tools like Add layer, Create Layer, Embed layers, etc.
- Edit: In this tab, you get editing tools like cut, copy, add shapes (circle, ellipse, polygon, etc.), fill ring, merge selected, etc., to make modifications on both vector and raster data types.
In this software, you can also find some measurement tools through which you can measure area, angle, and length of a map or location. Besides this, you can also use this software to annotate different parts of the GIS map. Another feature that I like about this software is its ability to support external plugins which you can use to enhance the functionality of this software.
MapWindow
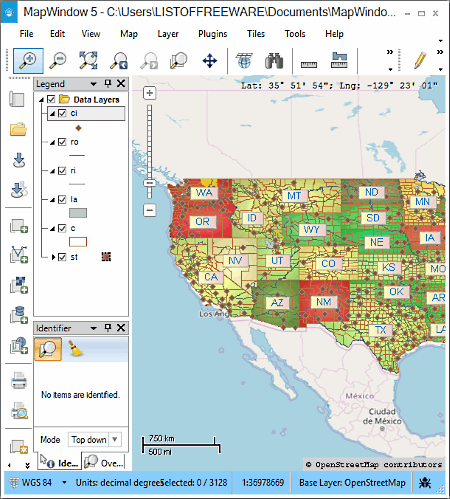
MapWindow is another free open source GIS software for Windows. Using this software, you can create, store, manage, manipulate, and analyze geographical data. In order to load and analyze the GIS data, you need to import all the GIS data to its four layers namely Vector Layer, Raster Later, Database Layer, and WMS Layer. In the Vector Layer, you can input shapefile data (.shp) to represent the visual part of the map. In the Raster Layer, you can input temperature, soil, and other data which you can view in the form of matrix of cells organized in rows and columns. Database Layer allows you to establish a connection of your project with the database that contains detailed information about the geolocation that you want to analyze. WMS Layer allows you to add Web Map Services of your choice like Google Earth, Tibco Spotfire, Geocortex Essential, etc.
After loading data on all the layers, you can view the geolocation map of the specified region along with various important data over the map. You can easily zoom-in on any region of the map and analyze a specific part of the map. A handy Data Layer section is also provided in it that you can use to enable or disable roads, counties, lakes, rivers, cities, etc. on the map. Besides analysis, it also provides various editing tools like Label Mover, Edit Layer, By rectangle, by Polygon, Merge Shapes, Explode Shapes, and more on the top toolbar.
This software also supports various plugins which you can use to further enhance the functionality of this software. After analyzing and editing the GIS data, you can print it or save the data in an XML file.
SAGA
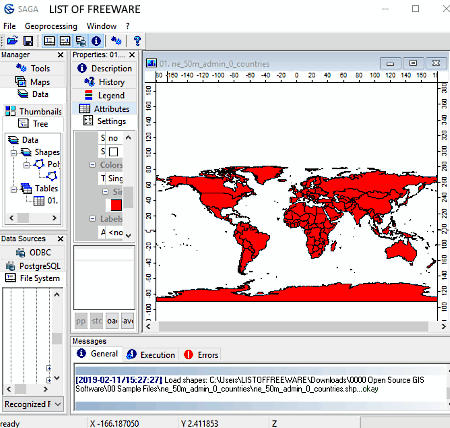
SAGA is an acronym for System For Automated Geoscientific Analysis. It is yet another free open source GIS software for Windows. Through this software, you can view, create, analyze, and edit both the Raster and Vector GIS data. You can also easily add multiple data layers over the map to show different data sets on a map. To enter data files and layers, it provides an internal file explorer. Some of the GIS data files that it supports are SHP, TXT, CSV, SPC, and DBF. For analysis and Geoprocessing, you can use its Geoprocessing Tab. In this tab, you can view a lot of geoprocessing sections.
Let’s take a look at some geoprocessing sections:
- Climate: Using it, you can process Earth’s orbital parameters, Evapotranspiration, Bioclimate Variables, Multilevel to Pint Interpolation, etc.
- Grid: In this section, you get various tools through which you can perform Cost Analysis, Fragmentation Analysis, Soil Analysis, Diversity of Categories, Pattern Analysis, and other operations.
- Imagery: It allows you to sharpen map image, colorize map, perform cloud cover assessment, enhance vegetation index, and perform other important map analysis operations.
- Projections: Using it, you can create reference points, define georeference for grids, move grid, rectify grid, warp shapes, set coordinate reference system, etc.
- Simulation: It allows you to simulate the Erosion, Fire Spreading, Water Retention Capacity, Successive Flow Routing, Human Impact On Nature, etc.
- Terrain Analysis: You can use it to perform land surface temperature, wind exposition index, effective airflow heights, flow depth, edge contamination, etc. analysis.
In this software, you can also create a histogram of a band. A histogram is basically a frequency distribution, in which band statistical data such as water vegetation, dry soil, etc. are represented in the form of a graphical pattern. To closely analyze the histogram and map, you can use the zoom and pan tools of this software. After the GIS data analysis and editing, you can save all the data in a local project file.
Whitebox GAT
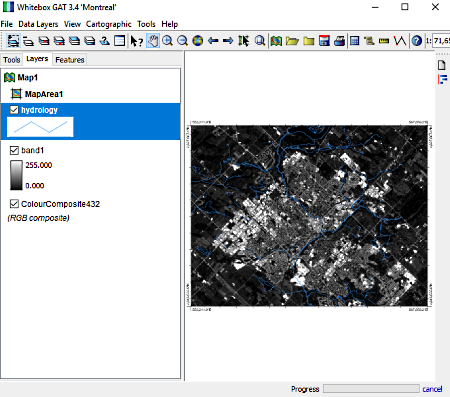
Whitebox GAT is the next free and open source GIS software for Windows. It is a Java-based software that requires Java in your system to run. It is mainly developed to perform geospatial analysis and data visualization. Using it, you can create, edit, and manipulate GIS data. It is also quite beneficial for environmental research and geomatics.
In this software, you can easily load maps and layers to show the geolocation and various associated data with it like population, roads, transport, economy, water reservoirs, etc. Most of the data, you can view over the map after adding new layers to the map. To add new layers, use its Data Layers tab in which you can find various layer manipulation tools like Raise Layer, Lower layer, Hide layer, Remove Layer, etc. All the changes on the layers will reflect over the map in real time. To closely analyze the layers, you can use its various viewing tools such as Zoom, Zoom Selection, View Histogram, etc.
Besides layers, you can also easily add and edit new or existing maps through this software. To do that, use its Cartographic Tab. Using this tab, you can add new map, insert map title, insert legend, insert neatline, insert map area, insert image, etc. In order to analyze various data that comes with layers and maps, you can use its Raster Calculator. This tool can be accessed from the Tool tab. In this tab, you can find more useful tools like Measure Distance, Palette Manager, Modify Pixel Values, On-Screen Digitizing, etc.
After analysis and manipulating both map and layers, you can export the map as PDF, PNG, JPEG, BMP, and more formats. Overall, it is one of the simplest open source GIS software to use and understand.
GRASS GIS
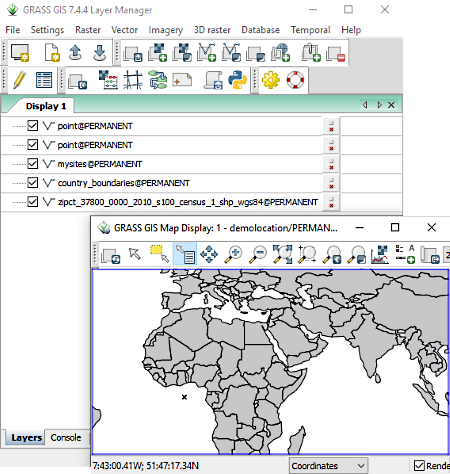
GRASS GIS or Graph resource Analysis Support System is yet another free open source GIS software for Windows. Using it, you can create GIS data and perform geospatial data management, geospatial data analysis, image processing, spatial modeling, and visualization. To perform GIS operation, it provides dedicated tabs namely Raster, Vector, Imagery, and 3D Raster.
Let’s take a look at all available tabs:
- Raster: Using this tab, you create or edit raster map, perform terrain analysis, generate surfaces, interpolate surfaces, overlay raster, etc. Plus, additional features to create hydrologic and groundwater modeling are also available.
- Vector: This tab is used to create or edit vector GIS data. For that, it provides tools like Buffer Vector, Point Analysis, Lidar Analysis, Linear Referencing, Generate Area from point, and more.
- Imagery: Using it, you can add and edit maps, sharpen maps, filter image, correct scanning distortion, classify image, rectify image or raster data, etc.
- 3D Raster: As its name implies, it is mainly developed to create a 3D raster map. However, other tools to generate reports and statistics are also available in it.
On the main toolbar of this software, you can find other important tools through which will be able to add both vector and raster layers over the map. Plus, an option to enable the dedicated vector editor is also present. Using its dedicated vector editor, you can easily edit vector layer and vector data. Plus, you can also view the main map along with all the GIS data on it. After the analysis, you can export the data as 3D Raster Maps, Vector Maps, and as Vector Map.
In this software, you also get conversion tools like Raster to Vector, Raster Series to Vector, Raster 2.5D to 3.5D, Vector to Raster, Vector to 3D Raster, etc. In general, it is another really good software to perform various GIS operations.
GeoDa
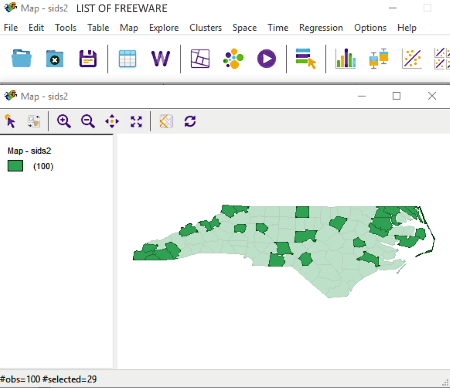
GeoDa is one more free open source GIS software for Windows. The primary purpose of this software is to perform spatial data analysis. Using it, you can perform analysis on various types of Vector Data files such as Shapefiles, Geodatabases, GeoJSON, MapInfo, GML, KML, and more. To analyze different types of data, it comes with various analysis tool tabs namely Table, Map, Clusters, Explore, Space, and Time. By using tools of these available analysis tool tabs, you can perform various analysis operations.
Some of the important operations that you can perform with this software are:
- Exploration of statistical results with the help of linked Charts and Maps.
- Analysis of temporal and spatial patterns across various linked views.
- You can use the average charts to compare the average time and space values.
- It lets you examine multivariate results and detect various important relationship between the obtained results.
- You can use test results of differential Moran’s I Test to determine the change in a variable over time for a given location is related to its neighbors or not.
- You can perform tests to determine whether variables are bundled in a specific space or not.
- You can map patterns of various non-spatial cluster techniques like k-means, hierarchical clustering, component analysis, etc.
- You can perform a nonparametric spatial autocorrelation test to determine when correlation ends between neighboring pairs.
- You can explore the sensitivity of your results when changes occur in the threshold values of your data.
Like other open source GIS software, you can also use it to view and explore maps and geographical locations, Plus, it is also quite easy in it to edit existing GIS data. After viewing, analyzing, and editing GIS data, you can save it as SHP, JSON, GDB, CSV, ODS, and more file formats.


Naveen Kushwaha
Passionate about tech and science, always look for new tech solutions that can help me and others.
About Us

We are the team behind some of the most popular tech blogs, like: I LoveFree Software and Windows 8 Freeware.
More About UsArchives
- May 2024
- April 2024
- March 2024
- February 2024
- January 2024
- December 2023
- November 2023
- October 2023
- September 2023
- August 2023
- July 2023
- June 2023
- May 2023
- April 2023
- March 2023
- February 2023
- January 2023
- December 2022
- November 2022
- October 2022
- September 2022
- August 2022
- July 2022
- June 2022
- May 2022
- April 2022
- March 2022
- February 2022
- January 2022
- December 2021
- November 2021
- October 2021
- September 2021
- August 2021
- July 2021
- June 2021
- May 2021
- April 2021
- March 2021
- February 2021
- January 2021
- December 2020
- November 2020
- October 2020
- September 2020
- August 2020
- July 2020
- June 2020
- May 2020
- April 2020
- March 2020
- February 2020
- January 2020
- December 2019
- November 2019
- October 2019
- September 2019
- August 2019
- July 2019
- June 2019
- May 2019
- April 2019
- March 2019
- February 2019
- January 2019
- December 2018
- November 2018
- October 2018
- September 2018
- August 2018
- July 2018
- June 2018
- May 2018
- April 2018
- March 2018
- February 2018
- January 2018
- December 2017
- November 2017
- October 2017
- September 2017
- August 2017
- July 2017
- June 2017
- May 2017
- April 2017
- March 2017
- February 2017
- January 2017
- December 2016
- November 2016
- October 2016
- September 2016
- August 2016
- July 2016
- June 2016
- May 2016
- April 2016
- March 2016
- February 2016
- January 2016
- December 2015
- November 2015
- October 2015
- September 2015
- August 2015
- July 2015
- June 2015
- May 2015
- April 2015
- March 2015
- February 2015
- January 2015
- December 2014
- November 2014
- October 2014
- September 2014
- August 2014
- July 2014
- June 2014
- May 2014
- April 2014
- March 2014
