9 Best Free Statistical Analysis Software For Windows
Here is a list of best free statistical analysis software for Windows. Using these software, you can analyze a large amount of data and also find out all key statistics. Statistical analysis is used in a wide range of fields like Actuarial science, Business Analytics, Environmental Statistics, Psychometrics, and more. In most software, you can easily analyze data of any statistical field without much hassle.
Using these software, you can perform various types of data analysis like Logistic Regression, Non-Parametric Tests, Multivariate Analysis, etc. Besides these, you can also find out basic statistics (mean, mode, median) and perform advanced statistical tests (ANOVA, Chi-Square, T-tests, etc.). To find out relation, dependency, proportion, etc. between two variables, you can draw graphs of various types like Bar graph, Pie graph, Line graph, Area graph, etc.
In general, all analysis software come with spreadsheet style interface. The input data file also mainly contains data in a structured manner with rows and columns to ease out the retrieval and viewing. The structure of data may be similar in all files, but file format can vary (TXT, XML, CSV, etc). Similar to input formats, you can also save the data along with graphs in various file formats.
My favorite Statistical Analysis Software For Windows:
PAST is my favorite statistical analysis software because it provides both basic and advanced statistical analysis tools. Plus, its spreadsheet-like interface allows you easily view, edit, and retrieve data and variables. It also provides various graphs which help you visualize the relationship between variables.
You can also check out lists of best free Stock Analysis, Nutrition Analysis, and Crash Dump Analyzer software for Windows.
PAST
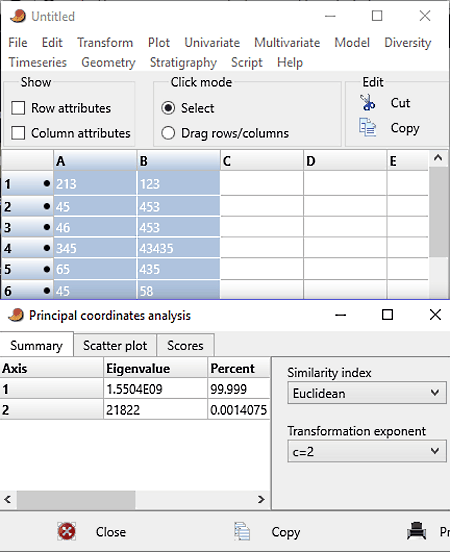
PAST or Paleontological Statistics is a free statistical analysis software for Windows. It comes with a lot of powerful features like data manipulation analysis, plotting, dealing with the univariate, multivariate statistics, ecological analysis, time series analysis, spatial analysis, and many others. It is best suited for data scientists and for people who analyze large researched data sets.
This software has a spreadsheet-like interface in which you can manually enter the data or open a data file of TXT, XLS, and DAT formats. Later, you can also save the spreadsheet as XLX, RTF, TXT, TPS, FAS, DIC, etc. file formats.
This software has various dedicated menus to calculate different types of data and plot graphs according to data. Let’s take a look at various menus and how these menus help you statistically analyze data sets.
- Univariate Menu: Using it, you can analyze univariate data (data that require only one variable) using the various built-in functions like ANOVA, Correlation, Normality test, etc. Plus, you can also calculate basic statistics through it, such as Mean, Median, Mode, Variance, Standard deviation, etc.
- Multivariate Menu: As its name implies, it is used to analyze multivariate data using various built-in functions like Ordination, Clustering, Tests (MANOVA one way, ANOSIM, etc.), etc. Before performing the analysis, select at least two data columns to get the result. The result will appear in a small popup window that may also contain graphs according to the selected test.
- Model: In it, you can find various common and complicated curve fitting models to construct curves or mathematical function like linear, polynomial, non-linear fit, etc.
- Diversity: This menu is used to determine ecological statistics (Diversity indices, Diversity t-test, SHE analysis, Beta diversity, etc.) and variation in various parameters of the terrestrial and aquatic ecosystems.
- Plot: It provides various graphs using which, you can visualize the relationship between variables. Presently, there are 16 types of graphs available that you can plot such as Pie, Bubble, Histogram, 3D plots, etc.
Overall, it is a really good software to view important statistics and to analyze data in different ways.
SOFA
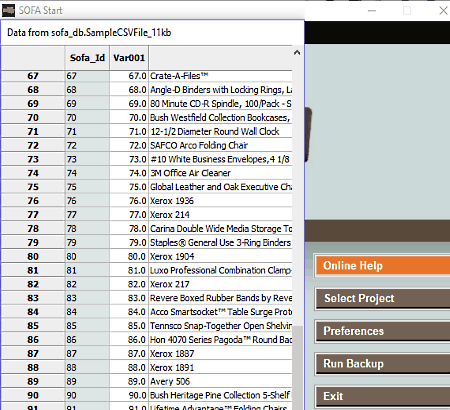
SOFA or Statistics Open For All is a free and open source statistical analysis software for Windows. In it, you can create and edit complex data sheets and also analyze statistics, perform basic statistical tests, make charts, create attractive project tables, and more. The main emphasis of this software is on ease of use and it definitely excels on that part. Plus, for novice users, it provides a Get started section that redirects you to an online help page which contains all steps along with screenshots to use this software.
There are many sections in this software using which you can perform statistical analysis, create tables manually, import data, draw graphs, etc.
Let’s take a look at available sections and what they do:-
- Enter/Edit Data: Using it, you can create a fresh table or edit an existing table which includes renaming of data tables, add, delete, or rename fields, change the datatype of fields, etc.
- Import data: This field is used to import data from files of various supported formats like CSV, TXT, XLS, TSV, etc. Plus, data from an existing SOFA table can also be imported by providing the table name.
- Report Tables: It is used to create custom tables of mainly Four types (Data List, Row Stats, Frequencies, and Crosstabs). Plus, report tables like Age vs Gender, Frequency vs Amplitude, etc. can also be built from here. Some CSS style files like monochrome, pebbles, grey spiral, etc. are also present to modify the styling or looks of the table.
- Charts: As its name implies, this section is used to make attractive charts with dynamic visual effects. Here, you get various categories of charts (Bar chart, Pie chart, Line chart, Area Chart, etc.) that you can easily create between two variables of a table like country vs gender, car vs age group, etc.
- Statistics: From here, you can perform various statistical tests on the data like ANOVA (to find difference in means between multiple groups when data is numerical), Chi-Square (it is used to determine whether there is a significant association between two variables or not), Paired T-test (it is good for looking differences in paired numerical data), etc.
After the statistical test, you can export the current output or entire report (including charts and table output) as PDF, Images, and as Spreadsheet file.
JASP
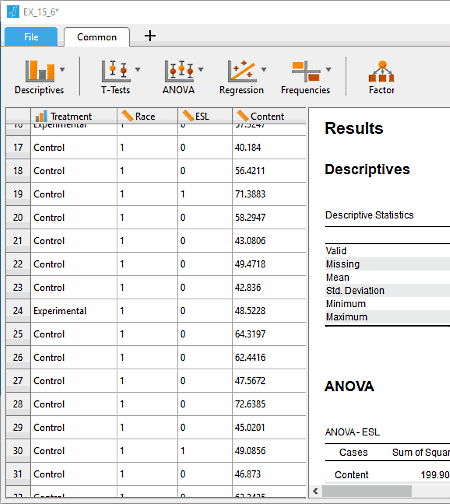
JASP is another free and open source statistical analysis software for Windows. It comes with an intuitive and user-friendly interface. Plus, it also offers standard analysis procedure both in Standard and Bayesian form. This software is especially useful to analyze dataset files of some selected file formats namely JASP, CSV, TXT, SAV, and ODS. After importing the dataset file, you can perform statistical analysis using on-screen statistical analysis sections.
Let us take a brief look at available statistical sections:
- Descriptives: In this section, you can perform descriptive and reliability analysis. At a time, you can select one or more than one variable to view the complete analysis result. Besides this, you can also view graphs (distribution, correlation, and boxplot graphs) along with individual statistics (mean, mode, median, variance, range, etc.) by ticking the respective checkboxes.
- T-Tests: In it, you can perform different types of T-tests on input datasets like Independent sample T-test, Paired sample T-test, Bayesian Paired sample T-test, and more.
- ANOVA: It is mainly used to view the difference in means between multiple groups when data is numerical and adequately normal. Similar to T-test, you get various variations of ANOVA like ANCOVA, repeated measures ANOVA, Bayesian ANOVA, etc.
- Regression: In general, regression is used to understand which among the independent variables are related to the dependent variable and to find out the type of relationship between independent variables. This section contains various different regression analysis techniques that you can apply to data like Correlation Matrix, Linear Regression, Logistics Regression, etc.
- Frequencies: Here, you can perform both standard and Bayesian Binomial test, Log-linear Regression, and also view Contingency tables according to selected variables.
Apart from these, you can also use some additional sections like Meta-analysis, Network, SEM, etc. to analyze data in more ways. After running all statistical analysis, you can view results of all analysis on the right side of interface that you can export as CSV and TXT files.
Jamovi
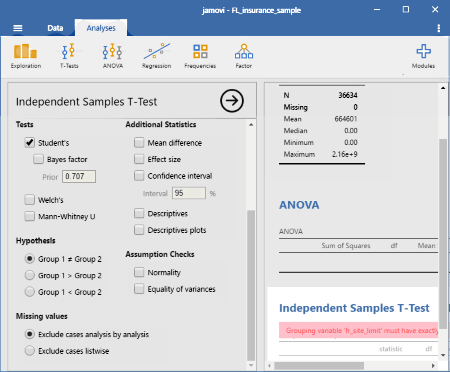
Jamovi is yet another free and open source statistical analysis software for Windows. This software is built to facilitate researcher and statistician to perform various statistical analyses. It is developed on the top of R statistical language to provide you the best possible and accurate analysis results.
The whole interface of this software is divided broadly into two main sections namely Data and Analysis. The Data section is used to create and edit the data tables. To do that, it provides various editing tools like Add variable, Delete variable, Insert row, Append row, Setup tools to change column properties and parameters, etc. The Analysis section basically contains various analysis tests through which, you can analyze different aspects of data. Along with analysis, you can find out all important statistics like Percentile values, Mean, Median, Mode, Distribution, Dispersion, etc.
The first tab of Analysis section is Exploration. In it, you can select multiple variables from the table and add them to Variables section to get the Statistics and graphs according to selected variables. To view statistics and graphs, just tick the checkboxes of various Statistics and Graphs options like Variance, Mean, Mode, Histogram, Bar Plot, etc. On the right side of the interface, you will view the result along with the graphs. This final report can be exported as CSV or saved as a Jamovi project file (OMV).
Similar to Exploration, you can analyze data using some other methods namely T-tests (used to determine the probability of difference between populations by considering t-statistic, t-distribution, and degrees of freedom ), ANOVA (used to determine whether there are any statistically significant differences between the means of three or more independent groups), Regression (used to examine the relationship between one dependent and one independent variable), Frequencies (in this tab, you can perform one sample protein test and create Contingency Table ), and Factor (you can perform various analysis on data like reliability analysis, principal component analysis, Explorotary factor analysis, etc.).
Statcato
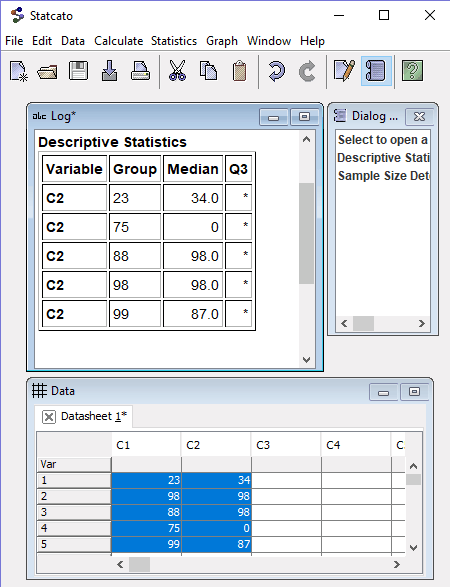
Statcato is a free, portable, java based statistical analysis software for Windows. In this software, you can find out various statistics, plot graphs to visualize the relationship between variables, evaluate mathematical functions, calculate probability distribution, p-values, etc.
In this software, you can enter data in the Data window that has a spreadsheet-like interface and perform all types of analysis on it. Besides manually adding the data, you can also import data files of some specific formats namely, XLS, CSV, TXT, and STC (Statcato project file) formats. The data of added file will appear in the Data Window which you can also edit if you want.
To perform statistical analysis, you can use the dedicated Statistics drop-down menu. In this menu, you will find a lot of statistical analysis tools like Basic Statistics (to find out mean, standard deviation, skewness, percentile, etc.), Sample size (to find out 1-population mean and variance), Correlation (to find a degree to which two variables are related), Regression (it is a set of statistical processes for estimating the relationships among variables), Analysis of variance using one and two way ANOVA, etc.
Similarly to Statistics menu, you can use Graphs and Calculate menus to create various types of graphs (Bar, Box, Dot, Pie, etc. graphs) and perform calculations like Binomial, Discrete, Geometric, Integer, P-value, etc. After the analysis, you can save the obtained graphs as PDF and PNG formats. Plus, you can also save or export analysis result datasheet in PDF, Excel, RTF, CSV, and Text formats.
Note: This software takes considerably longer time to load data files when compared to other software. Occasionally, it also freezes while loading the data.
PSPP
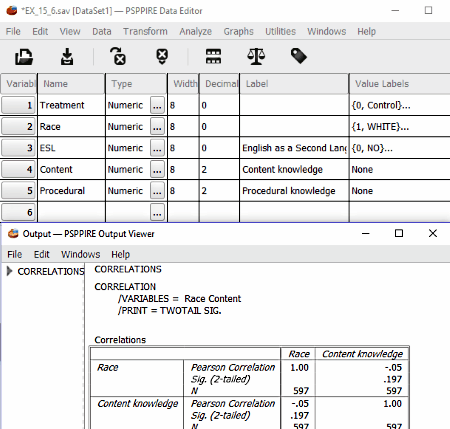
PSPP is one more free statistical analysis software for Windows. This software is created as a replacement for the proprietary program SPSS. Almost all features and way of operation of this software is quite similar to SPSS with some minor exceptions like no Time bombs i.e. your copy of PSPP will not expire in future due to some time limitation.
In this analysis software, you can perform various operations like Linear and logistic regression, Descriptive statistics, T-tests, Measures of association, Cluster analysis, Reliability and factor analysis, Non-parametric tests, and more. Plus, you can also plot Graphs (Histogram, Scatterplot, and Bargraph) using variables of input files. In this software, you can open and analyze data of mainly Data and Syntax files. Besides these formats, you can also open data of other file formats like TXT, HTML, ODT, etc., but you cannot perform analysis, and other operations on them.
This software is not only used to analyze statistics, but you can also create your own data sequence by manually entering the data in the newely created file. All the data is filled in a spreadsheet-style interface.
On the main interface, you can view the data in two categories namely Data View and Variable View by selecting the respective field. To make statistical analyzing easy, this freeware provides a dedicated Analyze Tab that contains all important analyzing tools like Descriptive Statistics, Compare means, Univariate Analysis, Regression, etc. Besides this tab, some other useful Tabs like Transform (to compute data, to count occurrences of values, to rank cases, etc.), Data (to perform sorting, transpose, aggregate, etc. operation), etc. are also available.
After analysis, you can save the final result and graph as PDF, HTML, ODT, TXT, PS, and as CSV file format.
KyPlot
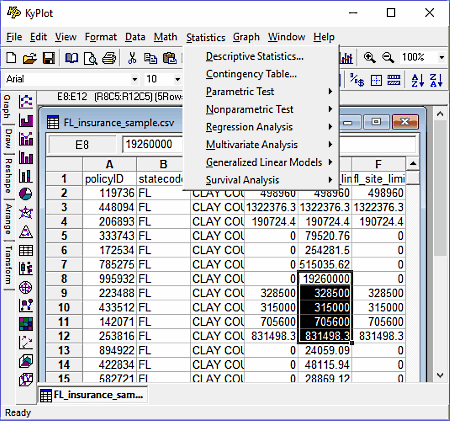
KyPlot is a completely free statistical analysis software for Windows. This software provides an integrated environment for statistical data analysis and visualization. In it, you can analyze data using a variety of computing and statistical methods with a spreadsheet interface. Plus, you can also visualize the results as graphs.
This software comes with basically two types of Windows namely, Spread and Figure. Spread gives you an Excel-type spreadsheet which contains all the data in rows and columns, that you can analyze using various statistical procedures including parametric, non-parametric tests, and multivariate analysis. Plus, the spreadsheet interface also supports calculations with cell formulae. In figure Window, you can simply draw schemes, create graphs, and also present them as a slideshow. The interface of this software also supports multiple windows that enable you to open and analyze multiple data files of various formats (Excel, Text, and Kyplot) at a time.
To perform statistical analysis, it comes with a dedicated Statistics drop-down menu. This Statistics menu contains various tests and analysis techniques such as Descriptive analysis, Contingency table, Parametric Test, Regression Analysis, Multivariate Analysis, and more. Performing statistical analysis in this software is not very difficult as you just need to select data entries from the table and then use one of the available analysis methods to get the result. I find only one problem with this freeware is that the result of analysis overwrites a part of the table. After the analysis, you can save the spreadsheet or table as CSV, XLS, TXT, PRN, HTML, etc. files.
Along with Statistics menu, you can use few more handy menus like Math (to perform matrix operation, Fourier transform, time series analysis, etc.), Graph (to create pie graph, bar graph, mech graph using table data), etc.
Epi Info
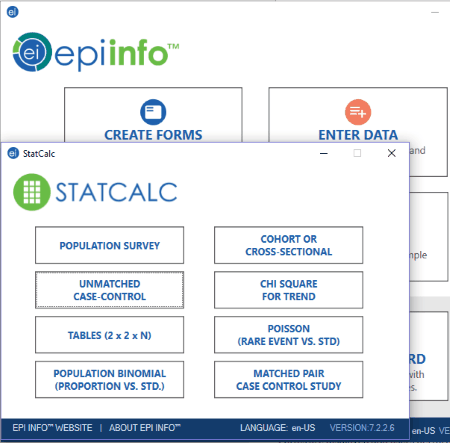
Epi Info is a free, portable statistical analysis software for Windows. In it, you can analyze statistical data, but it is mainly used for the rapid assessment of disease outbreaks and for the development of small to mid-sized disease surveillance systems.
To assess rapid disease outbreaks and to develop disease surveillance system, this software provides Five main sections on its interface which are:
- Create Forms: Using this section, you can create surveys and questionnaires to gather all the necessary data from targeted areas.
- Enter Data: This section automatically creates database from accumulated answers of surveys. From here, you can also access, view, and edit stored data of various existing databases.
- STATCALC: It is a dedicated statistics calculation section using which, you can find out Population Survey (to perform simple random sampling), Population Binomial (to find probability of success calculated from the outcome of a series of success–failure experiments), Chi-Square (to find linear trend in proportions), Poisson (to get the difference in rare event vs standard events), Cohort or Cross-Sectional, etc.
- Analyze Data: It is used to read and analyze data which is entered in the Enter data section. To use this section, you need to know the programming language used in this software. If you are familiar with the language, then you can easily produce tables, graphs, Maps, etc., by incorporating simple commands such as READ, FREQ, LIST, TABLES, etc. in the syntax.
- Map: It displays geographic maps with data from Epi Info. Epi Map displays Shapefiles containing the geographic boundaries marked with data that results from the Analysis module.
gretl
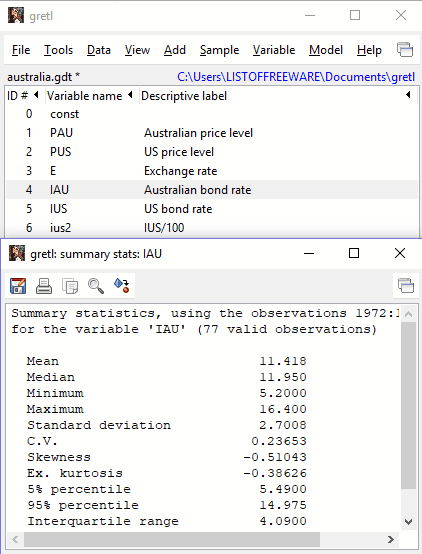
gretl is a free and open source statistical analysis software for Windows. It is specially designed to perform Econometric analysis on a set of data. To analyze the data, you need to provide the relevant data file of any of supported formats, like CSV, TXT, XLX, ODS, DAT, etc.
The tables and variables of an added data file will appear on the main interface which you can edit. The main advantage of this software is that you can view the full summary statistics (mean, median, minimum, maximum, skewness, etc.) of individual rows of data using the right-click menu. Some other handy features which you get in the right click menu are Correlogram, Periodogram, Time series plot to draw graph, Frequency distribution, etc. Besides this, you can perform more statistical analysis using Tools like Statistical table, Test statistics calculator, Non-parametric tests, etc., which are available in the Tools drop-down menu.
In this freeware, you can also plot various distribution graphs (chi-square, Poisson, binomial, etc.), Time series Plot, Boxplot, Normal Q-Q plot, etc. graphs using the entered data. The output graphs can be saved as PDF, PNG, EPS, EMS and can also be printed directly.
After analysis, you can save all data as Gretel database file or you can also export individual variables of the data file as CSV, Octave, Stata, Gretel database file, etc.


Naveen Kushwaha
Passionate about tech and science, always look for new tech solutions that can help me and others.
About Us

We are the team behind some of the most popular tech blogs, like: I LoveFree Software and Windows 8 Freeware.
More About UsArchives
- May 2024
- April 2024
- March 2024
- February 2024
- January 2024
- December 2023
- November 2023
- October 2023
- September 2023
- August 2023
- July 2023
- June 2023
- May 2023
- April 2023
- March 2023
- February 2023
- January 2023
- December 2022
- November 2022
- October 2022
- September 2022
- August 2022
- July 2022
- June 2022
- May 2022
- April 2022
- March 2022
- February 2022
- January 2022
- December 2021
- November 2021
- October 2021
- September 2021
- August 2021
- July 2021
- June 2021
- May 2021
- April 2021
- March 2021
- February 2021
- January 2021
- December 2020
- November 2020
- October 2020
- September 2020
- August 2020
- July 2020
- June 2020
- May 2020
- April 2020
- March 2020
- February 2020
- January 2020
- December 2019
- November 2019
- October 2019
- September 2019
- August 2019
- July 2019
- June 2019
- May 2019
- April 2019
- March 2019
- February 2019
- January 2019
- December 2018
- November 2018
- October 2018
- September 2018
- August 2018
- July 2018
- June 2018
- May 2018
- April 2018
- March 2018
- February 2018
- January 2018
- December 2017
- November 2017
- October 2017
- September 2017
- August 2017
- July 2017
- June 2017
- May 2017
- April 2017
- March 2017
- February 2017
- January 2017
- December 2016
- November 2016
- October 2016
- September 2016
- August 2016
- July 2016
- June 2016
- May 2016
- April 2016
- March 2016
- February 2016
- January 2016
- December 2015
- November 2015
- October 2015
- September 2015
- August 2015
- July 2015
- June 2015
- May 2015
- April 2015
- March 2015
- February 2015
- January 2015
- December 2014
- November 2014
- October 2014
- September 2014
- August 2014
- July 2014
- June 2014
- May 2014
- April 2014
- March 2014
