13 Best Free Infographic Maker Software
Infographics according to Wikipedia are “Graphic visual representations of information, data, or knowledge intended to present information quickly and clearly“. Infographics are easy to understand by common people, and hence are widely used nowadays to impart information to the masses. It has also been possible due to the latest advancements in Computer technology, which makes it quite easy to create stunning Infographics. Data visualization options, like: Time-series, Statistical distribution, maps, hierarchies, and networking options can be incorporated into the Infographs to make them informative, or they can be simply represented using visuals. While looking for the list of Infographic maker software, I longed for those software which can be used to easily draw beautiful shapes, add graphs, charts, symbols, and option to choose from a set of Infographic themes. Some of these software can be used to draw Infographics for a variety of genre, like: Business, Marketing, Education, Computers, Networking, Civil, Mechanical, etc.
Making Infographics involves a lot of work, like: Collecting data, Arranging data, Select and planning a format for Infographics, and Designing Infographics. While designing Infographics, the selection of an appropriate software proves out to be a herculean task. This article takes care of this problem of yours, as it provides a list of the best free Infographic maker software.
My Favourite Free Infographic Maker:
My favorite free Infographic maker software is, OpenOffice Draw. It has all the basic requirements of a good Infographic maker software, and lets you organize your data using built in tools. Create your own Infographics using different graphs, and charts in order to properly display your data. OpenOffice Draw also lets you insert images, shapes, icons, and also provides professional software drawing tools to help you make beautiful Infographics. You can make your Infographs visually appealing, and informative using a variety of shapes, and symbols. I know that this is traditionally the part of Office Suite, but frankly, I liked it the most.
You can also check out the list of Online Infographic Maker, and Online Banner Makers.
Here are the Best Free Infographic Maker Software for Windows:
OpenOffice

OpenOffice Draw proves out to be a very useful Infographic maker software. It is not marketed as an Infographic maker, but has basically most of the tools to make it a pretty good free Infographic maker software. With the help of OpenOffice Draw, you can easily draw cool Infographs as per your requirement. Different types of graphs, charts, symbols, shapes, and images can be inserted into the Infograph to make it informative, and visually appealing. Add layers, beautiful style text, effects, and 3D shapes to add a professional touch and feel to your Infograph. Infographs can be saved as ODG, OTG, SXD, STD, HTML, PDF, SWF, and various popular image formats, like: BMP, EPS, EMF, GIF, JPEG, MET, PBM, PCT, PGM, PNG, etc.
Tableau
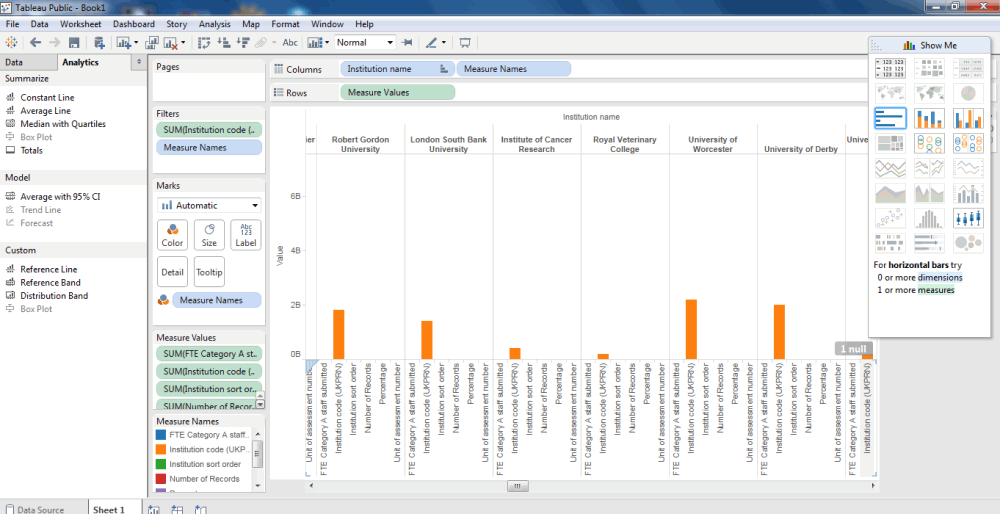
Tableau is a very useful software for designing Infographics, and presents cluttered data in an easy to understand format. The best part is that you can connect this software to your existing data file (like, Excel, Access, etc.) to take data from that, and organize that data in the form of an Infograph. Connect Tableau to the data file which you want to organize, like: Excel, Text File, and Access file. You can import different format data files in it, like: XLS, XLSX, XLSM, TXT, CSV, TAB, MDB, ACCDB, etc. to easily render the data in presentable format. Include, or exclude certain entries, and select the options to present your data using various types of charts, and graphs. It also lets you create stories, worksheet, and dashboard. Different formatting options can be set to present the data in a beautiful and eye catching format. With the free version you can save your data to Tableau public, which is accessible by everyone. Share your Infographic using Facebook, Twitter, embed code, and link. You can also download the data as Tableau Workbook, PDF, Image, Crosstab, and Data. In order to use Tableau you have to create an account, and login first.
Calligra Gemini
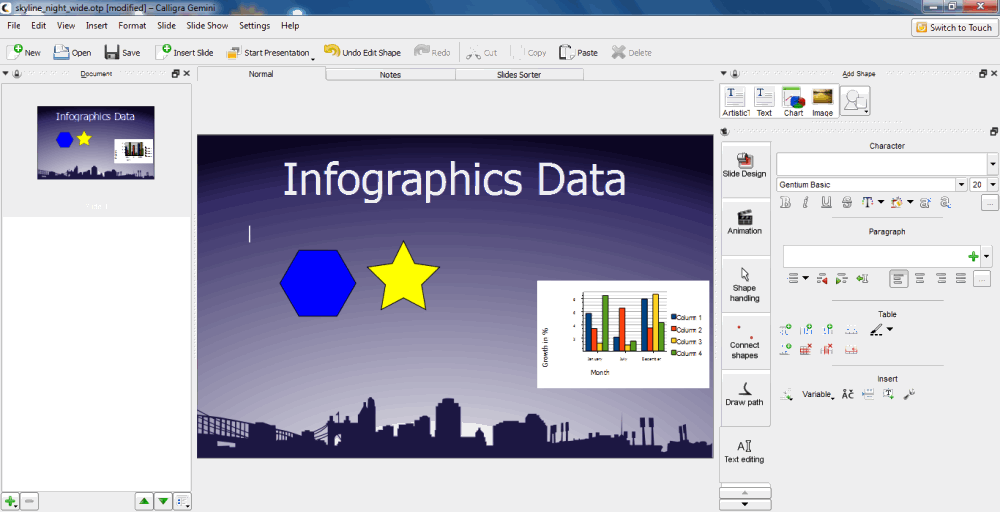
Calligra Gemini is a pretty resourceful software while designing Infographics. You can open, or create text, word document, and presentation files in it, or open files from library, and cloud. Choose from the list of beautiful Infograph templates as per your requirements. You get the option to insert images, charts, text, shapes, artistic text, vector images, graphs, etc. to make your own Infograph, and save it as ODP, OTP, ODT, ODM, TXT, DOC, DOCX, PDF, HTML, etc.
Grapholite
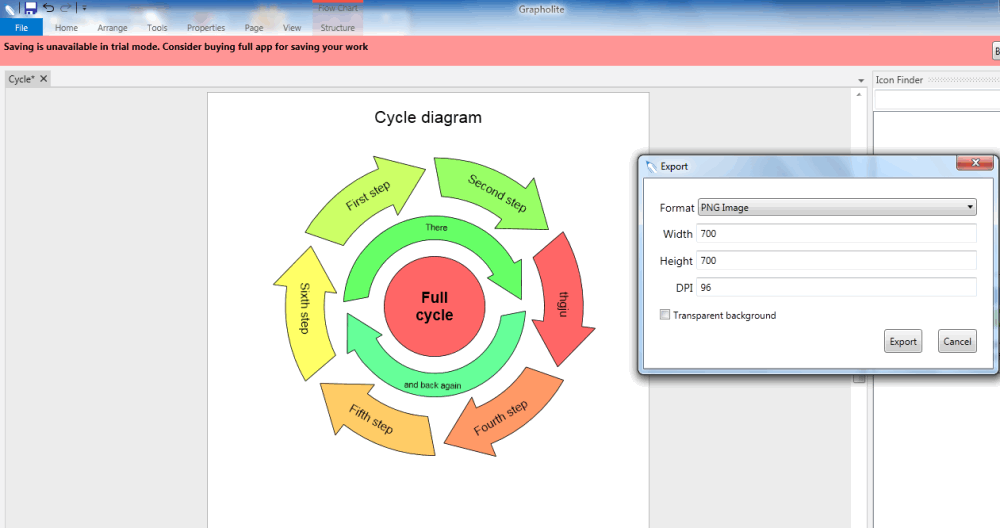
Grapholite is a very easy to use software, which can be used to design stunning Infographics. This software can be used to design different types of Infographics, like: Flowchart, Floor plan, Network layout, Mind map, Org chart, UML, GUI mockup, Site map, custom Infographics, etc. Grapholite provides you the feature to either select a template, create from scratch, or select from a list of samples. These Infographic templates can be edited and modified further by inserting different shapes, and images using stencil. If you are not satisfied with the built in shapes, then search for the icons using the icon finder, and use them into your Infographic file. You can select the page size, layout, and orientation of the Infographic file. This freeware lets you group, un-group, and resize the shapes and icons. You have the option to move an object to the front, or back. Although you cannot save your work in trial mode, you can still export the file in different formats, like: PNG, JPEG, SVG, PDF, and VDX.
Inkscape
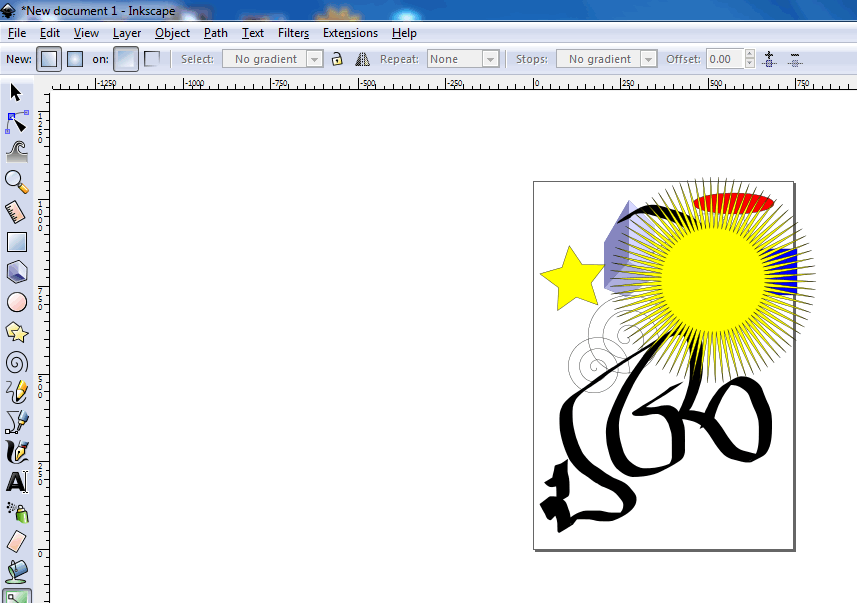
Inkscape is a very useful, and popular image editing freeware which you can use to make your own Infographics. Insert, and edit several shapes, calligraphic brush strokes, text, or images to your Infograph and create the basic layout. You can use layers and different object options, like: clip, mask, group, ungroup, etc. to set and fix the location of the objects used in the Infograph. Path options, and path effects can be selected to achieve the desired shapes, and orientation of the objects. Add filters, and extensions options to add a final touch on the infograph, like: bevel, blur, bump, color, distort, arrange, color, export, gcodetools, raster, render, etc. You can save your Infograph in different file formats, like: SVG, PDF, PNG, PS, EPS, EMF, WMF, ODG, etc.
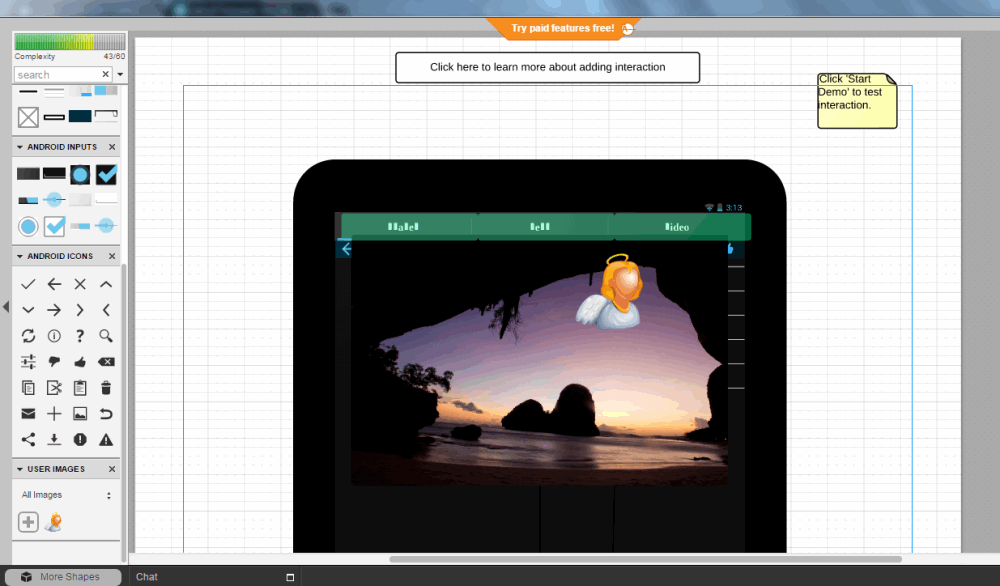
Pencil

Pencil is a very simple, and handy Infographics software. There are a number of shapes, and icons which can be inserted into the Infographs. Some of them are: Common Shapes, Web Elements, Widgets, GUI, Flowcharts, Android Mobile, iOS mobile, wire frames, stencils, and UI elements. You can group, ungroup, and lock the elements. There is also an option for developer tools, which provides you with several advanced options, like: Stencil generator, N-patch Script generator, export as layout, etc. Associate other programs with Pencil to edit the files further. All these features are quite easy to use, thereby helping you create your own Infographics. After completing your design, export your Infograph as PNG, Single Web page, PDF, SVG, ODT, or take a printout.
Lucidchart
Lucidchart is a Google Chrome Extension, which can be used as an elementary Infographic software. You can either select from a list of inbuilt templates as the basic framework, or start from scratch. You can add several inbuilt items, like: standard tools, flowchart, containers, shapes, upload your own images, or search for images on Google, Icon Finder, and Visio. Provide a professional look to your Infographic image using tools, like: layers, add color palettes, default styles, fonts, etc. You can also set the page size, orientation, and margins before saving in different formats, like: PDF, PNG, PNG with transparent background, JPEG, and VDX. Share your Infographic image on Facebook, Twitter, and Google+, or as an e-mail. You can also invite collaborators to work along with you on the project. In order to use Lucidchart, you need to login to the software first. As a free version, it incorporates a limitation to neither let you edit more than five active documents, nor add more than 60 objects per document. Once you go premium, you can access premium shapes, edit or export Visio files, and access revision history.
draw.io
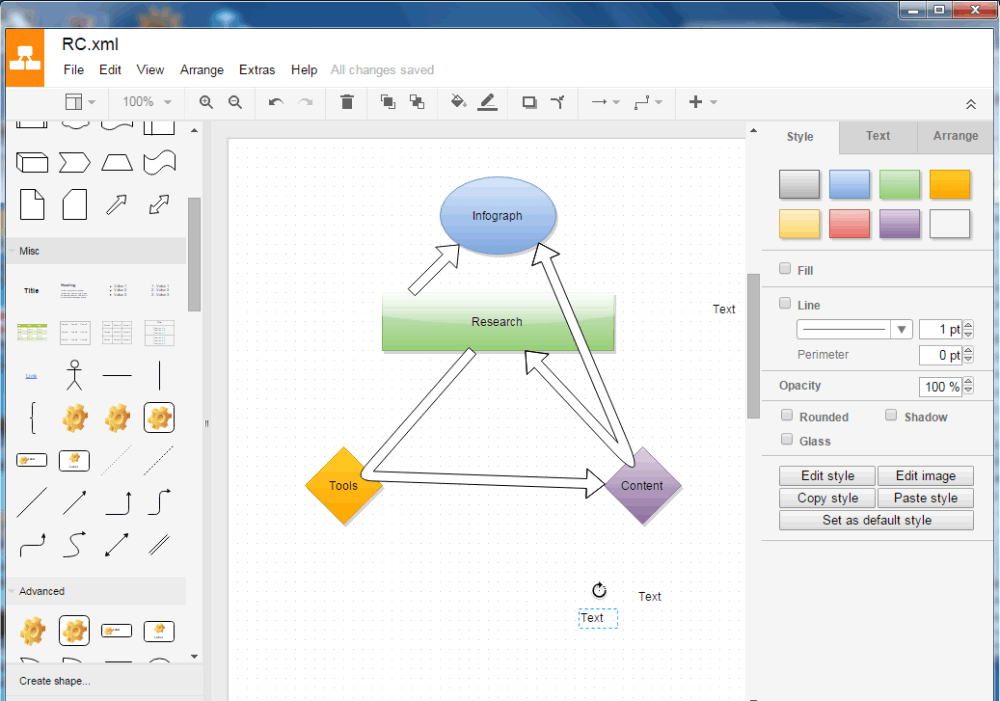
draw.io is another easy to use Google Chrome Extension which you can use to create Infographics, and spread your thoughts. It can be used to create Infographics for different fields, like: Software, networking, business, mechanical, floorplans, EIP, electrical, cabinets, etc. Different objects, like: flowchart, arrows, clipart, UML, iOS, android, azure, etc. can be inserted into your Infographics, using simple drag and drop. You can insert images, and choose the layout of the Infographic. This free software provides you other options to create and edit shapes using codes, add layers, flip and turn the images, select the paper size, and export the Infographs as SVG, HTML, and XML.
GIMP
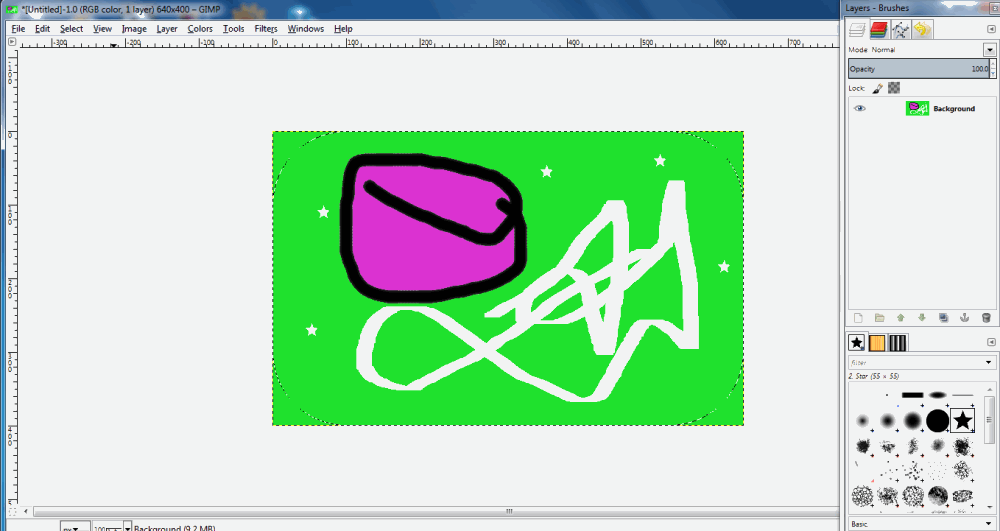
GIMP is a very robust software, which can be used to create your own Infographics. Although it is not quite easy to draw shapes using GIMP, but you can download any of these GIMP plugin: Gimp shape creator, Path Shape creator 3, Shape Paths, etc. Using these, you can easily add and edit shapes. This software also lets you insert pictures, and edit them. Layers can be added to edit, and enhance images. It lets you use several color options, tools, and filters into your Infographics. Some of these tools are: color balance, hue, saturation, colorize, posterize, blur, enhance, distort, noise, etc. You can also save your Infograph as XCF, GZIP, PIX, FLIC, GIF, JPEG, EPS, etc.
Dia
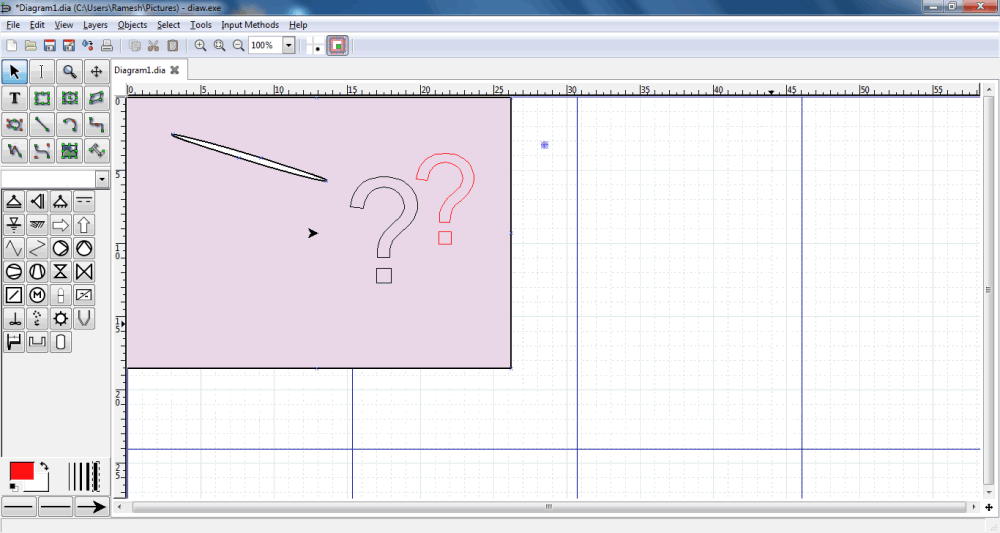
Dia is a feature rich freeware that you can use as an Infographic maker. A number of tools can be used for drawing scientific, and engineering Infographics by inserting icons and basic shapes with the help of drag and drop tools. The shapes are classified under different categories, like: assorted, flowchart, UML, databases, civil, jigsaw, lights, ER, electric, etc. Add layers, and insert images into your Infographs to make it more appealing. Group and ungroup several objects, and bring the objects forward or backward. You can also select different options, like: page size, page layout, and other page options. Save your Infograph in a number of formats, like: DIA, EMF, EPS, PDF, PS, PNG, TIFF, GIF, JPEG, etc.
Gliffy

Gliffy is a simple, and easy to use Infographic maker software. You need to simply drag and drop objects, like shapes and symbols, to create Infographics. You can insert various items, that are useful for drawing different personalized Infographics, like using basic drawing tools, and personalized tools. These tools include: basic shapes, flowchart, swimlanes, BPMN, Entity-Relationship, Network, Venn Diagrams, User Interface, Sitemap, Images, and Floorplan. You can also add images, but they must be in GLIFFY format. Use several other tools to make your Infograph look appealing, like: Group, Ungroup, bring the image to the front, move the image back, zoom, and pan the image. Save the Infographic in GLIFFY, JPEG, or PNG. You need to login in order to use the software.
Diagram Designer
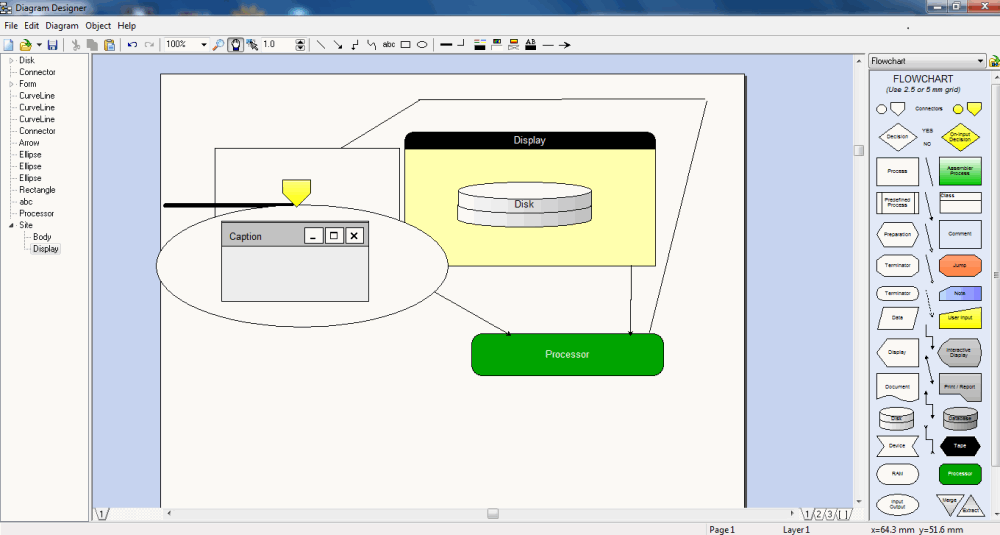
With the help of Diagram Designer, easily create beautiful Infographs. This freeware provides you an easy to use interface, in a beautiful format. It can be used to design electronics, and computer Infographs. A number of theme templates are available to help you design Infographs, like; Electronic symbols, Flowchart, GUI, and UML class diagram. You can create, and save your own templates, add layers, and insert your own images. The components inserted into the infograph are shown in the sidebar, which can be easily edited and removed if required. You have the option to save your Infograph as DDD, and export as JPEG, EMF, PNG, GIF, MNG, BMP, CUR, ICO, WMF, and PCX.
ARIS Express
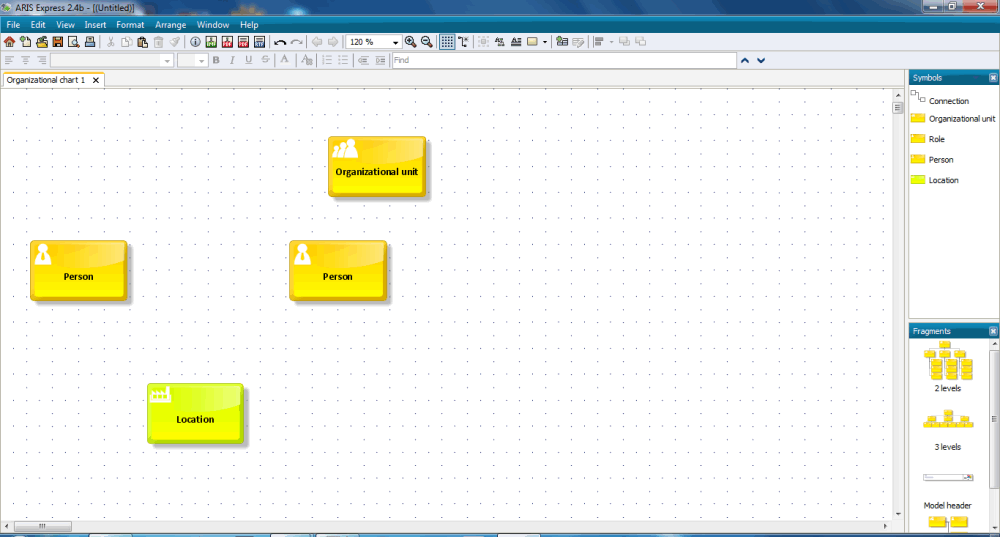
ARIS Express is a very good software to design Infographics, but in order to use it you need to register and login to the software. You can select from a number of templates (model types) as per your requirement, like: organizational chart, process landscape, data model, IT infrastructure, BPMN diagrams, Whiteboard, Business process, system landscapes, and general diagrams. It facilitates you to insert several symbols, and a set of inbuilt fragments into your Infographics. Using this software, you can import VISIO files, and other graphic files into your Infographics. Export your Infographics into different formats, like: JPEG, PNG, EMF, PDF, RTF, and ADF.


About Us

We are the team behind some of the most popular tech blogs, like: I LoveFree Software and Windows 8 Freeware.
More About UsArchives
- May 2024
- April 2024
- March 2024
- February 2024
- January 2024
- December 2023
- November 2023
- October 2023
- September 2023
- August 2023
- July 2023
- June 2023
- May 2023
- April 2023
- March 2023
- February 2023
- January 2023
- December 2022
- November 2022
- October 2022
- September 2022
- August 2022
- July 2022
- June 2022
- May 2022
- April 2022
- March 2022
- February 2022
- January 2022
- December 2021
- November 2021
- October 2021
- September 2021
- August 2021
- July 2021
- June 2021
- May 2021
- April 2021
- March 2021
- February 2021
- January 2021
- December 2020
- November 2020
- October 2020
- September 2020
- August 2020
- July 2020
- June 2020
- May 2020
- April 2020
- March 2020
- February 2020
- January 2020
- December 2019
- November 2019
- October 2019
- September 2019
- August 2019
- July 2019
- June 2019
- May 2019
- April 2019
- March 2019
- February 2019
- January 2019
- December 2018
- November 2018
- October 2018
- September 2018
- August 2018
- July 2018
- June 2018
- May 2018
- April 2018
- March 2018
- February 2018
- January 2018
- December 2017
- November 2017
- October 2017
- September 2017
- August 2017
- July 2017
- June 2017
- May 2017
- April 2017
- March 2017
- February 2017
- January 2017
- December 2016
- November 2016
- October 2016
- September 2016
- August 2016
- July 2016
- June 2016
- May 2016
- April 2016
- March 2016
- February 2016
- January 2016
- December 2015
- November 2015
- October 2015
- September 2015
- August 2015
- July 2015
- June 2015
- May 2015
- April 2015
- March 2015
- February 2015
- January 2015
- December 2014
- November 2014
- October 2014
- September 2014
- August 2014
- July 2014
- June 2014
- May 2014
- April 2014
- March 2014
