12 Best Free 3D Graphing Software For Windows
Here is a list of best free 3D graphing software for Windows. These are the free graphing software which let you plot 3-dimensional graphs along with 2-dimensional ones. You can plot Points, Vectors, Planes, Equations and Functions, Cylinders, Parametric Equations, Quadric Surfaces, etc. Most of these support Cartesian, Spherical, and Cylindrical coordinate systems. These also provide various graph rendering styles to choose from, such as points, lines, surface, wireframe, contour, intersection, etc. You can customize graph appearance by using shaders, shadow, focus blur, color scheme, etc., options. In some of these, you can also animate 3D graph. You can rotate axes, zoom into graph, view graph from different perspective, etc.
You can import datasets in different formats and plot respective graph. The output graph can be saved as different file formats including PDF, PNG, BMP, SVG, JPG, etc. You can use many of these as calculators to solve various math problems.
My Favorite 3D Graphing Software For Windows:
From this list, I quite liked Microsoft Mathematics as it provides all essential and advanced tools to plot 3D graphs and perform various calculations. Plus, it lets you animate 3D plot too.
You may also like some best free Quadratic Equation Grapher Software, Linear Equation Grapher Software, and Scientific Graph Software for Windows.
Microsoft Mathematics
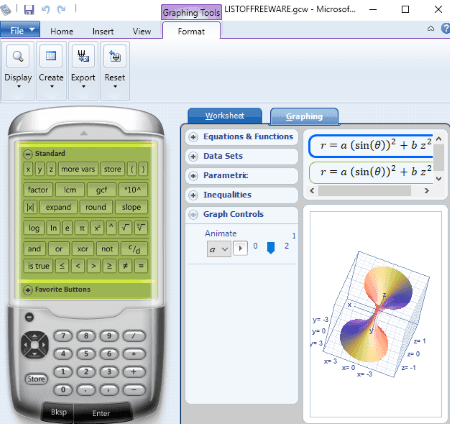
Microsoft Mathematics is a popular calculator software and 2D and 3D graphing software for Windows. In its Graphing section, you can plot equations and functions, datasets, parametric, and inequality. It supports Cartesian, Spherical, and Cylindrical coordinate systems. Not one, you can plot multiple functions at a time using it. It provides some graph controls using which you can animate 3D graph. You can visualize graph using options like hide axes, hide outer frame, proportional display, color surface/wireframe, etc. It also lets you automatically rotate an axis clockwise or counterclockwise. You can save the graph as PNG, JPG, and BMP images.
It is one of the best mathematical calculators. It is easy to use as compared to other software. You can solve linear, algebraic, quadratic, differential, and calculus problems. It also provides matrices calculator, unit converter, and more.
Algebrus
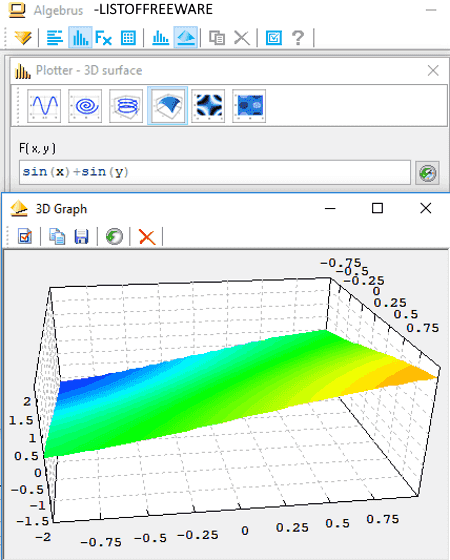
Algebrus is a free 3D graphing software for Windows. It lets you plot 3D parametric line and 3D surface graphs. Apart from that, you can also plot heights map, contour lines, line, and 2d parametric line graphs. It provides an Evaluator tool which lets you solve quadratic equations, cubic equations, polynomial derivatives, polynomial roots, etc., view values of various constants, convert unit, perform geometrical calculations, etc. This tool also lets you plot different types of graphs such as autocorrelation plot, data plot 3D, compass chart, error plot, histogram, lag plot, pie chart, normal probability plot, etc. Additionally, it provides an XPascal Editor tool too.
How to plot 3D graph in this free software:
- Firstly, click on Plotter button from its toolbar. From here, you can select a 3D graph to plot including 3D parametric line and 3D surface.
- Now, enter the mathematical function and hit the Plot button. It will display 3D graph of entered function in a new window.
- In this 3D graph window, you can configure some graph settings including title, x, y, and z caption, enable legend and heights, graph style (scatter, surface), line color, fill color, line style, etc.
- You can copy graph to the clipboard or export graph as BMP, WMF, and EMF files.
It is another one of nice 3D graphing software with a good set of features.
SciDAVis
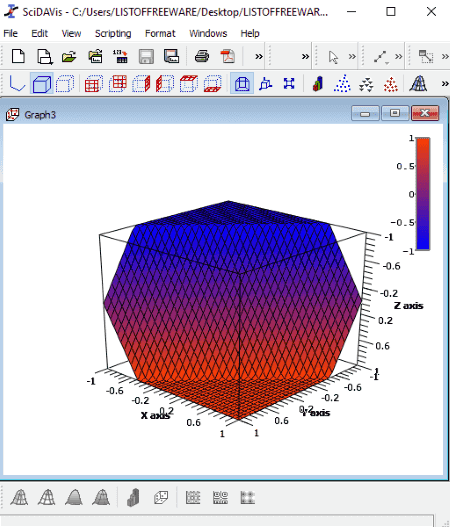
SciDAVis is an open source graphing software which lets you create both 2D and 3D graphs. To draw 3D graphs, you need to add Z column from Table menu. You can draw 3D graphs of Trajectory, Bars, Scatter, and Ribbon types from functions and matrices. In order to plot 3D surface, you can define a function and range of X, Y, and Z axis. You can customize surface plot by setting up colors, axis title, line width, scale, etc., options. It lets you select a rendering style from Wireframe, Hidden Line, Polygon Line, and Mesh and Filled Polygon. You can easily navigate through graph and change orientation to view it from different angles. You can export 3D graph as BMP, EPS, GIF, PDF, JPG, etc., files.
This software is a really good graphing software. Apart from graphing, it also provides Statistics on Rows/Columns, FFT, Correlate, Autocorrelate, Convolute, Deconvolute, etc., analysis tools. It provides results log, project explorer, plot wizard, etc., windows to easily manage a project.
GraphCalc
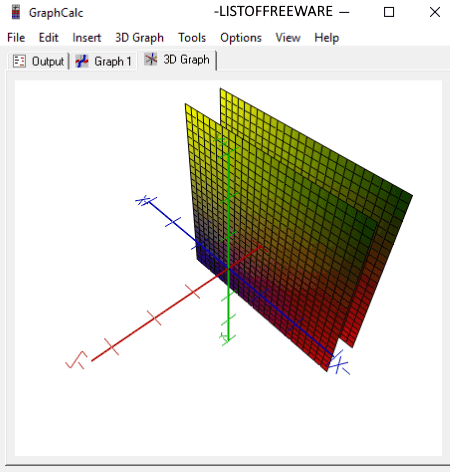
GraphCalc is another free 3D graphing software for Windows. In its 3D Graph tab, you can plot 3D graphs for mathematical equations. You can enter an equation and range to plot respective 3D graph. At a time, it can plot 3D graph of 6 equations. You can setup some general settings like tick intervals, color scheme, origin offset, etc. You can also evaluate an equation. Other than that, you can copy graph to the clipboard, export to DXF file, save as Bitmap image, or directly print it.
It is an open source graphing and calculator software. It can plot graphs for Linear, Cubic, Trigonometric, Quadratic, and other supported equations. It also lets you calculate basic arithmetic operations, trigonometry problems, conversion, etc., problems. Some geometrical calculations can also be performed including area, surface area, volume, etc.
Veusz
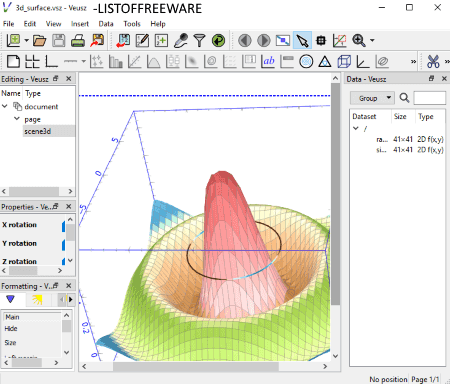
Veusz is another free open source 3D graphing software for Windows. On the interface of this software, you can plot 3D graph for a dataset. You can draw error, surface, point, volume, multigraph, etc., types of 3D plots in it. Some examples of 3D graphs are given in it which can be imported to the software. These examples help you understand how to draw 3D graphs in it. Also, it lets you plot multiple 3D graphs in different windows.
To plot 3D graphs, you can create dataset or import datasets from CSV, TSV, text, HDF5, FITS, etc., files. You can view graph by zooming it, customize appearance of the graphs, create colored graphs, etc. The final graph can be saved in various formats like SVG, PDF, EMF, PNG, JPG, BMP, etc.
Graphing Calculator 3D
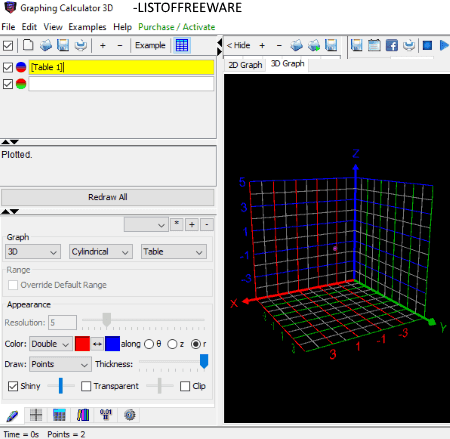
Graphing Calculator 3D is a free software to plot scatter points and mathematical equations. It is another 3D graphing software on this list. Cartesian, Polar, Cylindrical, and Spherical are the supported coordinate systems in it. You can plot graphs of parametric, implicit, and regular equations. You can draw different types of graph including points, lines, surface, wireframe, contour, and intersection.
To plot 3D graphs, you can import coordinates in CSV and later, the coordinates can be exported as CSV files too. It provides some examples of equations to simulate and plot graphs for. It lets you change graph appearance by customizing color, resolution thickness, transparency, shiny, etc., parameters. You can also define axis range, axis color and appearance, use functions and constants library, configure precision settings, etc. To navigate through 3D graph, you can change view to top, bottom, front, back, etc. It also provides animate rotation around z-axis option.
Note: In this free edition, many features are restricted such as export, print, etc. You can upgrade to its paid version to use all its features without any restrictions.
MathGrapher
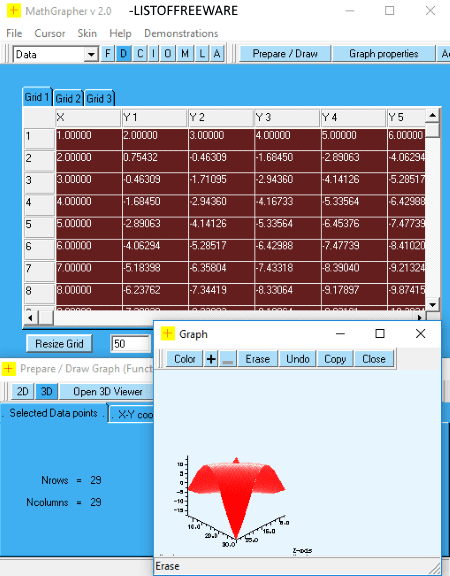
MathGrapher is another free 3D graphing software for Windows. You can plot graphs for simple as well as complex functions. It includes plotting graphs for statistical data, linear and nonlinear curve fitting, iterations, matrices, ordinary differential equations (ODE’s), Lindenmayer systems, and cellular automata. For each of these, it provides the demonstrations so that you can get familiar with the working of this software.
It provides a separate 3D graph viewer from where you can rotate graph and view it from different angles or perspective. You can customize graph by modifying shading, axes, and cross-section parameters. You can copy 3D graph or directly print it.
RINEARN Graph 3D
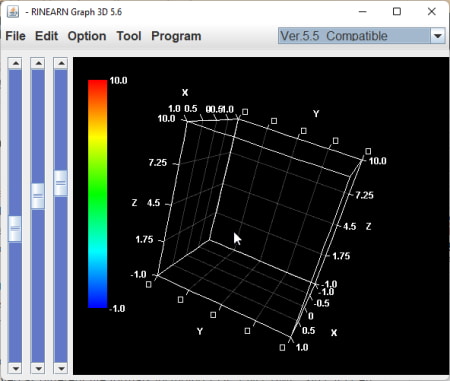
RINEARN Graph 3D is another free 3D graphing software for Windows. It is a Java-based software that requires Java to run. Using this software, users can easily create 3D graphs by using the X, Y, and Z-axis. By moving the sliders up and down, users can view the change in the axis of graphs. Besides this, it also lets users create graphs by precisely entering the X, Y, and Z axes values.
The graph generated by this software is 3D and can be moved in any direction through the mouse. On this software, users can also load existing 3D graphs of VCSSL file format. It also lets users run the 3D graph animation and export the graph animation frames as images.
gnuplot
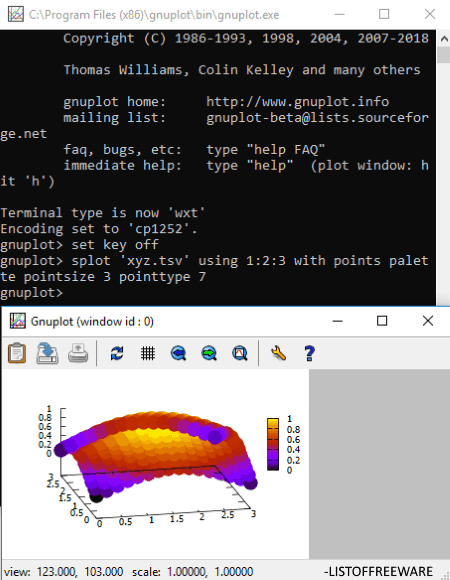
gnuplot is a free open source 3D graphing software. It is a command line software which lets you plot 3D graphs using specific commands. Here is an example of command to draw a 3D graph.
How to plot 3D graph using commands in gnuplot:
This is an example of plotting projection view of some data in XYZ format.
- First, create a dataset file in TSV, CSV, text, or any other supported formats. Paste the file in the directory where you have installed gnuplot.
- Now, run gnuplot application file and type following two commands in order to plot 3D graph:
1. set key off
2. splot 'lof.tsv' using 1:2:3 with points palette pointsize 3 pointtype 7
In above command, lof.tsv is the input data file. You can view how the graph looks like in above screenshot. From the graph window, you can view, zoom, and rotate the 3D graph. It lets you save the graph as PNG, SVG, PDF, and EMF files.
Similarly, you can plot surface plot graph using simple command: splot x*y. To know more about its commands for drawing graphs, check here.
MathGV
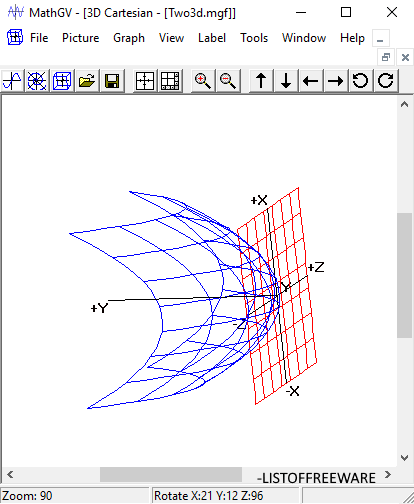
MathGV is a free graphing software for Windows. It lets you plot 2D and 3D Cartesian graphs and polar graphs. You can enter a mathematical function and plot a graph for it. It provides basic view options including rotate and zoom. You can customize axes, color schemes, etc. The final graph can be saved as picture file in BMP and JPG formats. It provides a Function Calculator tool too which lets you compute value of a Math function.
GeoGebra
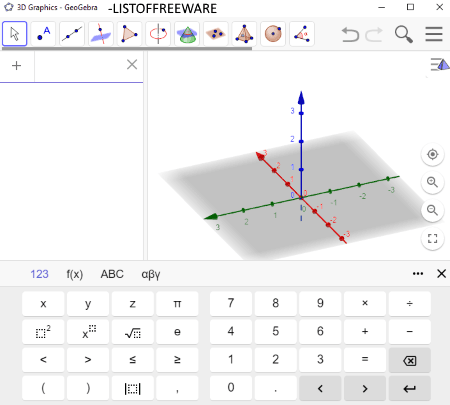
GeoGebra is yet another free 3D graphing software for Windows. It lets you plot 2D and 3D graphs for mathematical functions. To plot 3D graph, go to its menu and from View, select 3D Graphics option. Now, you can easily plot a 3D graph. For drawing 3D graph, it provides various tools such as point (point, point on object, intersect, midpoint, attach/detach point), line (line, segment, ray, vector), special line (perpendicular, parallel, angle bisector, tangent, locus, polar or diameter), polygon, circle, arc, and conics (ellipse, hyperbola, parabola, etc.), intersection, plane, geometric solids (pyramid, prism, cone, cylinder, etc.), and sphere. You also get transformation, measurement, text, rotate, zoom, view, etc., tools. You can export 3D graph to an image file.
GeoGebra is basically a software for designing mathematical objects used for calculus, algebra, and geometry. It provides some more features including Probability Calculator, Spreadsheet, etc. It provides an Exam Mode option too which lets students use this software to evaluate their skills.
Functy
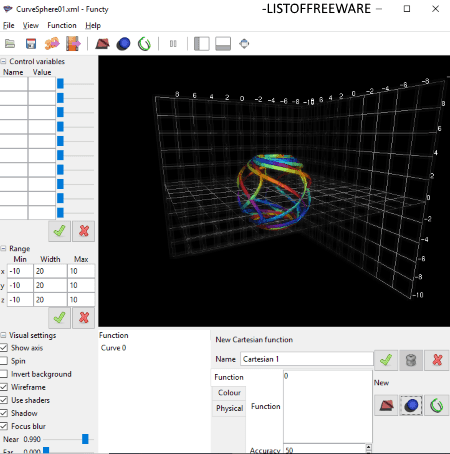
Functy is an open source 3D graphing software for Windows. It lets you plot 3D graphs of functions including Cartesian, spherical, and parametric curve. To plot 3D graph, you can specify axis range and setup visual settings like show axis, spin, invert background, wireframe, use shaders, shadow, focus blur, etc. As it displays 3D graph animation, you can export animation as PLY, STL, or BMP or simply export graph as PNG, VDB, PTL, etc., formats.
It provides dedicated section to add functions, view 3D graph, and setup configurations. So, you can easily plot 3D graphs in it.


About Us

We are the team behind some of the most popular tech blogs, like: I LoveFree Software and Windows 8 Freeware.
More About UsArchives
- May 2024
- April 2024
- March 2024
- February 2024
- January 2024
- December 2023
- November 2023
- October 2023
- September 2023
- August 2023
- July 2023
- June 2023
- May 2023
- April 2023
- March 2023
- February 2023
- January 2023
- December 2022
- November 2022
- October 2022
- September 2022
- August 2022
- July 2022
- June 2022
- May 2022
- April 2022
- March 2022
- February 2022
- January 2022
- December 2021
- November 2021
- October 2021
- September 2021
- August 2021
- July 2021
- June 2021
- May 2021
- April 2021
- March 2021
- February 2021
- January 2021
- December 2020
- November 2020
- October 2020
- September 2020
- August 2020
- July 2020
- June 2020
- May 2020
- April 2020
- March 2020
- February 2020
- January 2020
- December 2019
- November 2019
- October 2019
- September 2019
- August 2019
- July 2019
- June 2019
- May 2019
- April 2019
- March 2019
- February 2019
- January 2019
- December 2018
- November 2018
- October 2018
- September 2018
- August 2018
- July 2018
- June 2018
- May 2018
- April 2018
- March 2018
- February 2018
- January 2018
- December 2017
- November 2017
- October 2017
- September 2017
- August 2017
- July 2017
- June 2017
- May 2017
- April 2017
- March 2017
- February 2017
- January 2017
- December 2016
- November 2016
- October 2016
- September 2016
- August 2016
- July 2016
- June 2016
- May 2016
- April 2016
- March 2016
- February 2016
- January 2016
- December 2015
- November 2015
- October 2015
- September 2015
- August 2015
- July 2015
- June 2015
- May 2015
- April 2015
- March 2015
- February 2015
- January 2015
- December 2014
- November 2014
- October 2014
- September 2014
- August 2014
- July 2014
- June 2014
- May 2014
- April 2014
- March 2014
