5 Best Free Flowing Software For Windows
Here is a list of Best Free Flowing Software For Windows. These freeware are used to analyze flow cytometry data stored in Flow Cytometry Standard (FCS) files. Some of these support TXT files too for the same. These provide different types of graphical plots in order to visualize, interpret, and analyze data from flow cytometry experiments. These plot types include Dot Plot, Density Plot, Intensity Plot, Histogram, Overlay Histogram, Cumulative Distribution, etc. graphs. You can also view total statistics like events, X/Y mean, geomean, median, etc. One of these provides a wide number of statistical analysis tools including Statistics Calculator, Calculate Ratio of Two Parameters, Advanced Cell Calculator, etc.
To elaborately analyze graphs, these software also provide tools like create region, marker, quadrants, zoom, pan, etc. These let you save statistical data to a TXT file. You can even export plot to an image like PNG, BMP, etc.
My Favorite Free Flowing Software For Windows:
Flowing Software is my favorite flow cytometry software for Windows. It provides a good number of tools to analyze FCS files. Plus, its user interface is quite simple and intuitive.
You may also like PID Simulator Software, Data Visualization Tools, and Statistical Analysis Software for Windows.
Flowing Software
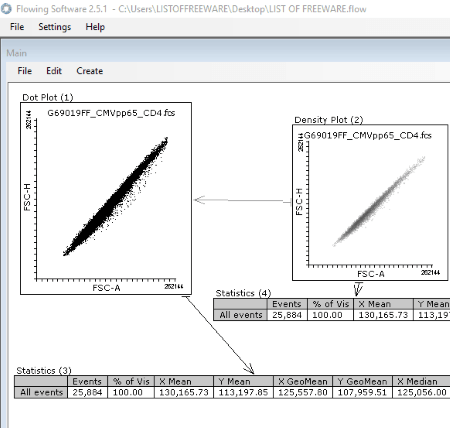
Flowing Software is a simple and easy to use flow cytometry software for Windows. It comes with various tools to analyze data from flow cytometry experiments. It lets you perform flow cytometry analysis on data stored in FCS and TXT (tab delimited) files. It provides a wide range of tools in different categories which are as follows:
- Visualization Tools: This category contains main graphical analysis functions including Dot Plot, Density Plot, Intensity Plot, Histogram, and Overlay Histogram.
- Metadata Tools: Here, you can find Metadata Viewer, Compensation Matrix, Parameter Data Viewer, and Keyword Viewer.
- Calculation Tools: Statistics Calculator, Calculate Ratio of Two Parameters, Advanced Cell Calculator, and Token tools can be accessed from here.
- Parameter Modification Tools: From here, you can change parameter names, change lin/log visualization, and create time axis.
- Data Modification Tools: You can find Virtual Gain and Compensate Data functions here.
- Collection Tools: This category offers you tools like Image Collector, Collector List, etc.
- Other Tools: Some additional tools like Text Box, Tool Group, Region Control Tools, Automation Tools (Folder Runner, Update Counter, etc.), etc. are also available in this flowing software.
How to perform flow cytometry analysis using Flowing Software
- Firstly, from File menu, open New Analysis. Now, from Create menu, select a tool for flow cytometry analysis. You can now open a FCS or TXT file containing flow cytometry experiments and analyse its related data. It lets you select multiple tools one by one and open related analysis on the main interface.
- You can create statistics (events, mean, geomean, media, etc.), create regions, copy data to clipboard export data to TXT file, etc.
- You can save the entire analysis in its native format for later use.
All in all, this one is a great flowing software to use to carry flow cytometry analysis. It is quite easy to use but in case you find any difficulty, you can refer to this video tutorial.
FlowPy
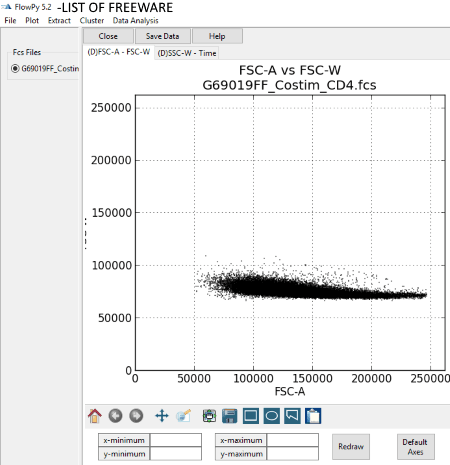
FlowPy is the next free flowing software for Windows in this list. You can open a FCS file or a Text file and then choose a plot type for flow cytometry analysis. It provides Histogram, Dotplot, and Cumulative Distribution graphs to visualize flow cytometry data. You can choose a parameter to plot respective graph, such as FSC-A, FSC-H, FSC-W, SSC-A, SSC-H, SSC-W, Time, etc. Checkout this link to know about these parameters.
Some features of this flow cytometry software to look out for:
- It lets you extract whole statistical data or partial data to a Text file.
- You can open different types of plots in different tabs in this software.
- In a plot tab, you get tools like pan, zoom, subplots, line, paste gates, etc.
- It provides Clustering feature to make clusters by selecting multiple parameters. Here, you get Static Initialisation, Binary Splitting, and Random Initialisation types of clusters.
- It provides Data Analysis tools namely Histogram Subtraction and Statistics (Total Statistic and Gate Statistics).
Cyflogic
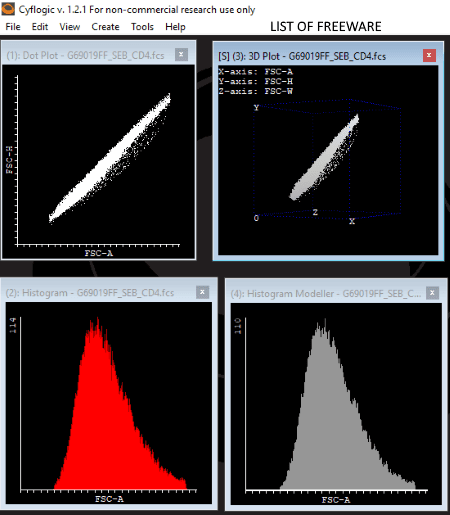
Cyflogic is another free flowing software to analyze flow cytometry data. It provides Dot Plot, Histogram, Histogram Modeller, Overlay Histogram, 3D Plot, and ClipBook statistical tools to visualize FCS files. There are a lot of features provided in this software to let you perform flow cytometry analysis. These include following options:
- You can open and view statistics including number, X mean, Y mean, % of visible, X geomean, and Y geomean.
- It lets you customize plot by using options like Show/Hide Quadrant, Show/Hide Region Lines, Invert Background Color, Enable/Disable Multicoloring, Change Plot Color, Show/Hide Marker Lines, Set Smoothing, etc.
- You can set fast draw limit and maximum event number.
- You can copy or even save plot data as TXT file. It lets you export plot diagram as BMP image too. In addition, you can save analysis view for later use.
- Some additional tools offered in this software are Batch Print, 360 Degrees Rotation, File Browser, Well Plate Browser, etc.
Note: It is free for non-commercial and academic use only.
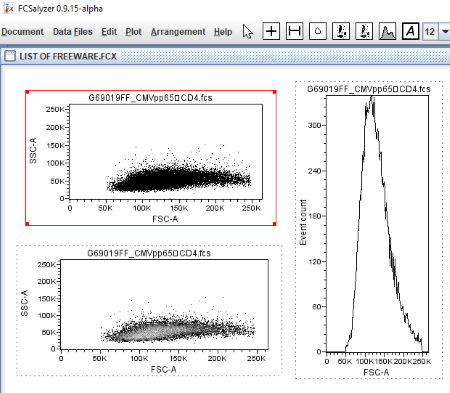
FCSalyzer
FCSalyzer is another one of flowing software in this list. It also lets you open and analyze FCS documents. Let’s checkout the steps to do so.
How to analyze flow cytometry data using this free software
First, you need to select a plot type from its interface. It lets you analyze flow cytometry data in form of Dot Plot, Histogram, and Density Plot. Now, select a FCS file to plot the respective diagram. As simple as that. You can use its tools like Quadrant, Marker, Adjust Regions and Gates, Text Area, etc. to analyze the plot. It also lists raw data, statistics, etc. You can also export statistics to a text file, save plot as PNG image, export plot events to a CSV file, etc. It lets you save analysis document to its native file format so that you can open it later.
Overall, it is a nice and portable flowing software. So, you can just carry it in a portable storage device and use on the go.
Cellular Symphony
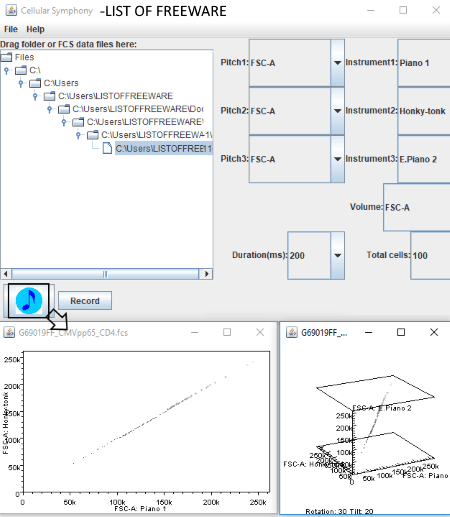
Cellular Symphony is a different kind of flowing software in this list. It is basically a musical representation of flow cytometry data where cells are denoted by musical notes. Simply drag FCS files to its file section, choose one of them, and then select Pitch parameters. The pitch parameters include FSC-A, FSC-W, FSC-H, SSC-A, SSC-H, SSC-W, Time, IL2 PE, Dump, etc. You can know more about these parameters here. Now, select respective instruments to sound each. You can also select note volume, duration of each cell’s note, and total number of cells to be sounded. After that, press play button and it will display dot plot as you can see in above screenshot. You can adjust plotted dot size and enable or disable grid too.
It also provides a Record option to record a MIDI file of sound generated. However, this function didn’t work fine for me during testing.
This is also a portable flow cytometry software which needs no installation and can be used on the go.


About Us

We are the team behind some of the most popular tech blogs, like: I LoveFree Software and Windows 8 Freeware.
More About UsArchives
- May 2024
- April 2024
- March 2024
- February 2024
- January 2024
- December 2023
- November 2023
- October 2023
- September 2023
- August 2023
- July 2023
- June 2023
- May 2023
- April 2023
- March 2023
- February 2023
- January 2023
- December 2022
- November 2022
- October 2022
- September 2022
- August 2022
- July 2022
- June 2022
- May 2022
- April 2022
- March 2022
- February 2022
- January 2022
- December 2021
- November 2021
- October 2021
- September 2021
- August 2021
- July 2021
- June 2021
- May 2021
- April 2021
- March 2021
- February 2021
- January 2021
- December 2020
- November 2020
- October 2020
- September 2020
- August 2020
- July 2020
- June 2020
- May 2020
- April 2020
- March 2020
- February 2020
- January 2020
- December 2019
- November 2019
- October 2019
- September 2019
- August 2019
- July 2019
- June 2019
- May 2019
- April 2019
- March 2019
- February 2019
- January 2019
- December 2018
- November 2018
- October 2018
- September 2018
- August 2018
- July 2018
- June 2018
- May 2018
- April 2018
- March 2018
- February 2018
- January 2018
- December 2017
- November 2017
- October 2017
- September 2017
- August 2017
- July 2017
- June 2017
- May 2017
- April 2017
- March 2017
- February 2017
- January 2017
- December 2016
- November 2016
- October 2016
- September 2016
- August 2016
- July 2016
- June 2016
- May 2016
- April 2016
- March 2016
- February 2016
- January 2016
- December 2015
- November 2015
- October 2015
- September 2015
- August 2015
- July 2015
- June 2015
- May 2015
- April 2015
- March 2015
- February 2015
- January 2015
- December 2014
- November 2014
- October 2014
- September 2014
- August 2014
- July 2014
- June 2014
- May 2014
- April 2014
- March 2014
