4 Best Free Open Source Statistical Software For Windows
Here is a list of best free open source statistical software for Windows. Through these software, you can perform various statistical analysis tasks like any standard statistical software listed in this article. But, as these software are open source, you get the flexibility to download, study, and manipulate their source codes. These software can be used in many fields such as Environmental Statistics, Psychometrics, Business Analytics, and more.
The primary purpose of these software is to extract and give you all the desired statistics from a large set of data which you can analyze. To get the desired result for the analysis, you can perform tests on input dataset like ANOVA, T-Test, Regression, Frequencies, etc. In the result, you get output values which you can analyze to understand important statistics about input data. Apart from analysis, you can also plot graphs like Bar graph, Pie Charts, Area graphs, etc., to visualize relationships between multiple variables. After performing the statistical analysis, you can save the output data in formats like CSV, TXT, XML, etc.
My Favorite Open Source Statistical Software For Windows:
SOFA is my favorite software it provides all essential statistical analysis tools and features. Plus, it also offers a complete help guide to help users to use this software.
I also liked JASP as it also provides a good number of statistical tests to evaluate and analyze a dataset.
You can also check out lists of best free Social Network Analysis, Graph Analysis, and Stock Analysis software for Windows.
SOFA
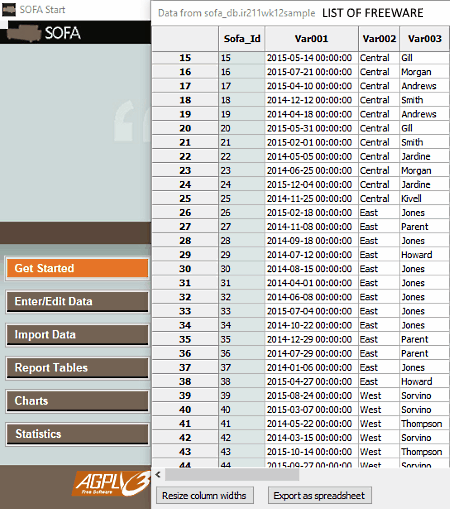
SOFA is a free open source statistical software for Windows. It is also known as Statistics Open For ALL. Using it, you can create and edit complex data sheets, create project tables, run statistical tests, make charts, etc. Plus, the main statistical analysis task can also be performed in it. This software also tries to make things as simple as possible for both advanced and novice users. Plus, it also offers a complete guide to use this software, that you can access by clicking on the Get Started button.
statistical, this software offers multiple sections namely Enter/Edit Data, Import Data, Report Tables, Charts, and Statistics.
Main Features of this open source statistical software:
Here are the important sections of this software which let you perform different activities related to statistical analysis:
- Enter/Edit Data: Using it, you can create a new table by entering the fresh data or edit an existing table by editing its existing data like name of tables, name of fields, data types, etc.
- Import data: It lets you import data from files of various formats such as TXT, CSV, TSV, XLS, ODS, etc. If you have an existing SOFA table, then you can also import it directly by providing its name.
- Report Tables: It allows you to create data list, row stats, frequency, and crosstabs custom tables. In it, you also get CSS Style files (pebbles, grey spiral, etc.) to customize the look of tables.
- Charts: As its name implies, it is used to create charts of dynamic nature of various types like Pie Chart, Area Chart, Bar Chart, Line Chart, etc.
- Statistics: It is the main statistical analysis section through which you can perform statistical tests like ANOVA, Chi-Squared, Mann-Whitney U, Paired T-test, etc.
After the statistical tests and analysis, you can export the output data or report in CSV, PDF, PNG, JPEG, etc. formats.
Final Thoughts:
It is one of the best statistical analysis software as it offers a good amount of statistical tests and analysis features. Plus, it is easy to operate and also provides a complete guide with screenshots to use this software.
JASP
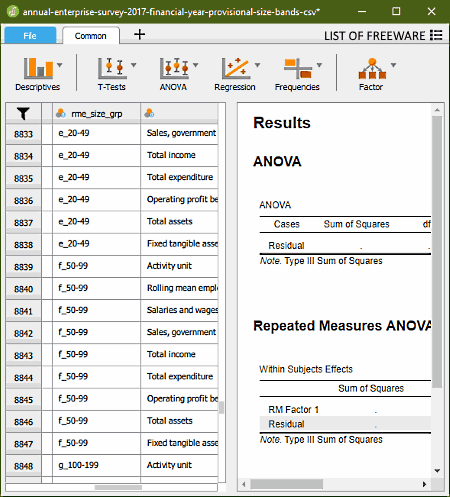
JASP is another free and open source statistical software for Windows. It is a simple and intuitive software through which you can perform various Frequentist and Bayesian analysis tests like Anova, Binomial test, Regression, T-Tests, and more. This software also supports files of JASP, CSV, TXT, SAV, and ODS formats, using which you can import datasets to this software. On its interface, you get six main sections through which you can perform various types of analysis.
Let us take a brief look at available statistical sections of this open source statistical software:
- Descriptives: This section is used to perform reliability and descriptive analysis. After loading the data, you just need to select one or more variables to view descriptive and reliability analysis results. Along with the analysis result, it also provides output graphs (boxplot, distribution, correlation) and statistics (mean, mode, variance, etc.).
- T-Tests: Using it, you can perform multiple types of T-tests like Paired Sample T-test, Bayesian Paired Sample T-test, Independent Sample T-test, etc., on input datasets.
- ANOVA: ANOVA or Analysis Of Variance is a group of tests which are used to test if there exists a significant difference between variables. Types of ANOVA test that you can perform on data sets include Repeated Measures ANOVA, Bayesian ANOVA, etc.
- Regression: This test is performed to examine the relationship between one dependent and one independent variable. In this section, you get various types of regression tests which you can statistical on data, such as Linear Regression, Logistics Regression, Correlation Matrix, Bayesian Correlation Matrix, etc.
- Frequencies: Just like other sections, it also lets you perform various types of frequency analysis tests like Bayesian Binomial Test, Log-linear Regression, Multinomial Test, etc. You can use the results of different tests to analyze the frequency of data.
After performing various tests, you can use their results for the analysis. Plus, you can also easily export all the results of different tests in CSV and TXT files.
Final Thoughts:
It is a beautifully designed software through which you can easily perform various statistical tests and use their results to analyze various aspects of input values and data sets.
Jamovi
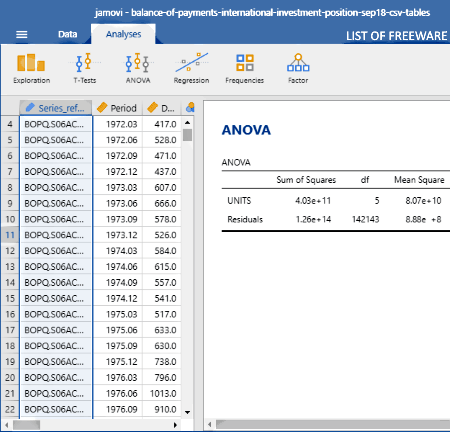
Jamovi is yet another free open source statistical software for Windows. This software is based on the R statistical language which provides the most accurate analysis results. It is primarily built for statistician and researchers so that they can perform various tests on input data and analyze output results.
This software is divided into two main categories namely Data and Analysis. By using the Data Section, you can add, edit, or delete data tables. In order to perform these operations, it provides tools like Insert Row, Append Row, Delete Variables, Add Variables, etc. In the Analysis section, you get various tabs through which you can perform various tests such as ANOVA, T-Test, Regression, Frequencies, etc.
Key features of this software:
Let’s take a look at all tabs of the Analysis section which let you perform various tests on input dataset:
- Exploration: Using it, you can explore one or more variables of input data or table and find out their descriptive values like Missing, Mean, Median, Maximum, Variance, Range, Shapiro-Wilk, etc. You can save the descriptive output result in CSV format.
- T-Tests: This test is used to compare two averages or mean to find out whether they are different or same. In this tab, you can select two or more table variables to see the mean difference, effective size, confidence interval, etc.
- ANOVA: This tab is used to find out significant differences between mean values if any. To find out the mean differences, you can perform ANOVA tests like One Way ANOVA, ANOVA, ANCOVA, MANCOVA, etc.
- Regression: Using it, you can find out differences between one or more dependent and one independent variable. To do that, you can perform Correlation Matrix, Linear Regression, N Outcomes, and more tests.
- Frequencies: It also contains various tests (Two Outcomes, N outcomes, etc.) which you can perform on data to find out a number of times an event occurred.
Data obtained in all different tests can be saved in CSV and OMV file formats.
Conclusion:
It is another really good open source statistical software through which you can perform various tests on input data sets to find out conclusive results.
gretl
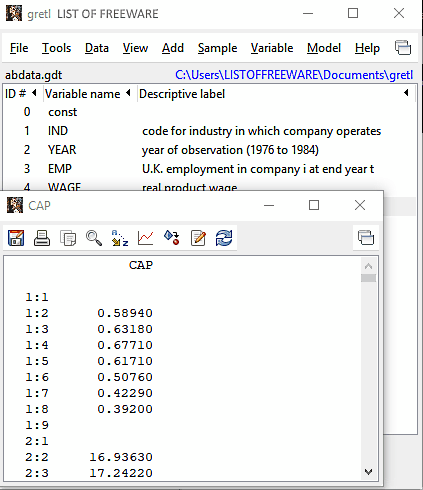
gretl is the next free open source statistical software for Windows. It is mainly used to perform Econometric Analysis on relevant data sets. The good thing about this software is that it can take data from various different file formats such as ODS, DAT, XLSX, TXT, CSV, etc. As soon as you import the data, you can view rows and columns with the data on its interface. By using the right-click menu, you can view full summary statistics of the data such as median, minimum, mean, maximum, etc. of every individual row. Other information regarding the data which you can view from the right-click menu are Periodogram, Time Series Plot, Frequency Distribution, Correlogram, etc.
In this software, you get some dedicated statistical analysis tools such as Test Statistics Calculator, Non-Parametric Test, Statistical Table, etc. You can find all the statistical analysis tools in the Tools menu. Apart from statistical analysis, you can also plot Normal Q-Q Plot, Time Series Plot, Boxplot, Distribution Graphs, etc. You can easily save all plotted graphs in formats like PNG, EPS, PDF, etc. Plus, an option to directly print the graph is also available.
Once the analysis and graph plotting gets completed, you can save the data in Octave, CSV, Gretel Database File, etc.
Final Thoughts:
This software contains some straightforward statistical analysis tools which you can easily use to evaluate important statistics about input data sets.


Naveen Kushwaha
Passionate about tech and science, always look for new tech solutions that can help me and others.
About Us

We are the team behind some of the most popular tech blogs, like: I LoveFree Software and Windows 8 Freeware.
More About UsArchives
- May 2024
- April 2024
- March 2024
- February 2024
- January 2024
- December 2023
- November 2023
- October 2023
- September 2023
- August 2023
- July 2023
- June 2023
- May 2023
- April 2023
- March 2023
- February 2023
- January 2023
- December 2022
- November 2022
- October 2022
- September 2022
- August 2022
- July 2022
- June 2022
- May 2022
- April 2022
- March 2022
- February 2022
- January 2022
- December 2021
- November 2021
- October 2021
- September 2021
- August 2021
- July 2021
- June 2021
- May 2021
- April 2021
- March 2021
- February 2021
- January 2021
- December 2020
- November 2020
- October 2020
- September 2020
- August 2020
- July 2020
- June 2020
- May 2020
- April 2020
- March 2020
- February 2020
- January 2020
- December 2019
- November 2019
- October 2019
- September 2019
- August 2019
- July 2019
- June 2019
- May 2019
- April 2019
- March 2019
- February 2019
- January 2019
- December 2018
- November 2018
- October 2018
- September 2018
- August 2018
- July 2018
- June 2018
- May 2018
- April 2018
- March 2018
- February 2018
- January 2018
- December 2017
- November 2017
- October 2017
- September 2017
- August 2017
- July 2017
- June 2017
- May 2017
- April 2017
- March 2017
- February 2017
- January 2017
- December 2016
- November 2016
- October 2016
- September 2016
- August 2016
- July 2016
- June 2016
- May 2016
- April 2016
- March 2016
- February 2016
- January 2016
- December 2015
- November 2015
- October 2015
- September 2015
- August 2015
- July 2015
- June 2015
- May 2015
- April 2015
- March 2015
- February 2015
- January 2015
- December 2014
- November 2014
- October 2014
- September 2014
- August 2014
- July 2014
- June 2014
- May 2014
- April 2014
- March 2014
