6 Best Free Scatter Plot Maker For Windows
This is a list of best free scatter plot maker for Windows. Using these software, you can easily get scatter plot for provided numerical data. These free scatter diagram maker let you plot scatter graphs in different styles. Scatter graph with smooth lines and markers, smooth lines only, straight lines with marker, straight lines, and bubbles are some of them. Thus, by choosing a suitable style, you can customize scatter graph for better data visualization and interpretation. Also, these software provide many customization options to better illustrate scatter graphs. To do so, you can enter title, subtitle, and also define X-axis and Y-axis. They also let you specify data range and customize data series for individual data range. So, these software to create scatter plot are quite helpful in data evaluation.
Some of these software let you save the scatter plot as JPEG, BMP, PNG, GIF, TIFF, PDF, etc. files. While in others, you also get option to save data with graph in VTS, XLS, XLSX, TXT, PDF, ODS, CSV, PMDX, PMV, XLT, OTS, SXC, STC, etc. formats.
In addition to scatter graph, these software even let you plot many other graphs in 2D and 3D views. Some of the important chart types are: Column, Bar, Pie, Line, Net, Area, Radar, etc.
My Favorite Scatter Plot Maker For Windows:
LibreOffice is one of my favorite scatter graph maker for Windows. In addition to scatter graph, it even lets you plot bar, line, pie, column, area, etc. graphs. Also, you can export graphs as image. Moreover, it is one of the best free alternatives to MS Office.
You may also like to checkout lists of best free data visualization, graphing software, and infographic maker software for Windows.
LibreOffice
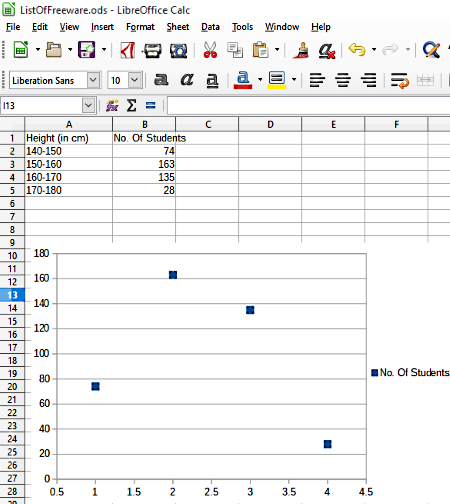
LibreOffice is one of the best free scatter graph maker software for Windows. Using this free office suite, in addition to scatter graph, you can also generate many other varieties of graphs including column, bar, pie, area, bubble, net, etc. Also, you can swap rendering style between 2D and 3D mode.
How to create scatter graph in LibreOffice:
To create scatter graph, you need to enter data in its spreadsheet, or load an Excel file containing the desired dataset. Now, select entire data and go through Insert > Chart > XY Graph (Scatter) path to access various chart related options. As you go through this path, it provides you certain chart settings related options, namely; Chart Type, Data Range, Data Series, and Chart Elements.
- Chart Type: This option lets you define a chart type and its corresponding rendering styles.
- Data Range: Using this option, you can specify whether data series is provided in rows or columns, and also mark first row or first column as label.
- Data Series: It provides you options to customize data ranges for individual data series, add/remove new data series, categories, data range, etc.
- Chart Elements: Here, you can add title, subtitle, name to axes, and enable display grids to appear on the graph, etc.
When you are done with all these options, click on Finish button and selected graph appears in the spreadsheet. Now, you can set it to the desired position and also resize it.
It even provides option named, Export as image to save plotted scatter graph as JPEG, BMP, PNG, GIF, TIFF, PDF, WMF, etc. files.
WPSOffice
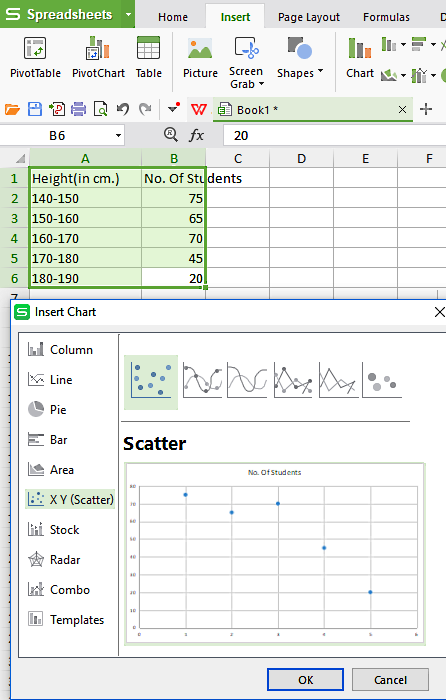
WPSOffice is another free software to create scatter graph for a given set of data. Using this scatter diagram maker, you can also plot line, column, pie, bar, area, radar, and many other types of graphs.
To create scatter plot, first of all, you need to enter data or open Excel sheet having desired data. After that, select complete data and go to Insert menu > Chart option. As you do so, you get option to choose chart type as X Y (Scatter) from the list containing aforesaid Chart types as well. Now, a preview of a normal Scatter graph is provided on the screen. It even lets you visualize scatter graph with smooth lines and markers, smooth lines, straight lines with marker, straight lines, bubbles, etc. Thus, by choosing suitable option, you can visualize trend-line also. Moreover, it also lets you add title and other graph details.
After creating scatter graph for given dataset, you can use its Save as Picture option to save generate graph as JPG, PNG, BMP, and TIF file, or save graphs as Template in CRTX format.
It provides an additional advantage over other software by facilitating with 1 GB of free cloud storage to WPS signed-in users.
OnlyOffice
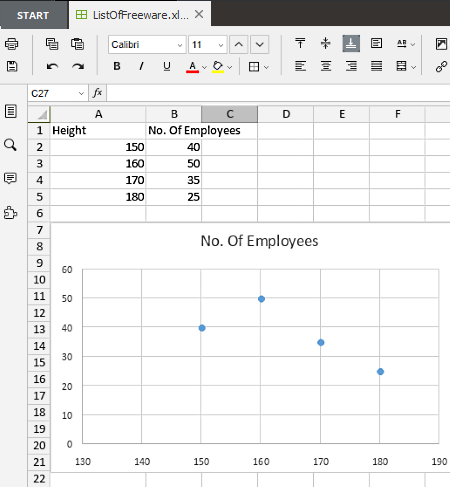
OnlyOffice is another free software that can be used as a scatter chart maker. After opening its Spreadsheet, you can enter data to plot different kind of graphs including bar, column, pie, line, area, XY (scatter), stock, etc. To create scatter plot, click on XY (scatter) graph and the graph will appear in the spreadsheet. But, do remember to select entire data prior to going to Charts menu.
It provides several configurable options to adjust size, data range, type of graph, etc. It even lets you create colorful graphs by filling desired colors in them. Also, you can adjust opacity, gradient, and many other parameters. Moreover, it lets you change graph title, data label, grid lines, horizontal and vertical axis title, etc.
To save generate scatter graph and corresponding spreadsheet, you can use Save options and specify file format as PDF, XLSX, ODS, or CSV format.
SSuite Personal Edition
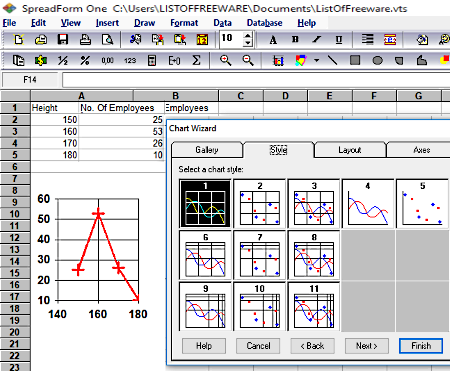
SSuite Personal Edition is another free scatter graph maker for Windows. Using this software, you can create Area, Pie, Contour, Line, Gantt, etc. graphs also. Additionally, it supports 2D and 3D graph generation mode.
To provide data set and generate the corresponding graph, you can enter values in its spreadsheet. Now, like other scatter graph maker software, you need to select entire data and go through Insert (menu) > Chart Option. As you do so, Chart Wizard window opens and lets you choose Chart type as XY (Scatter), chart ‘Style’, Layout (chart title, chart footnote, series data along row or column, etc.), axes, etc. It also lets you visualize trend-line in the scatter graph.
It lets you save scatter graph files in VTS, XLS, and TXT formats or Print files as PDF also.
Softmaker Free Office
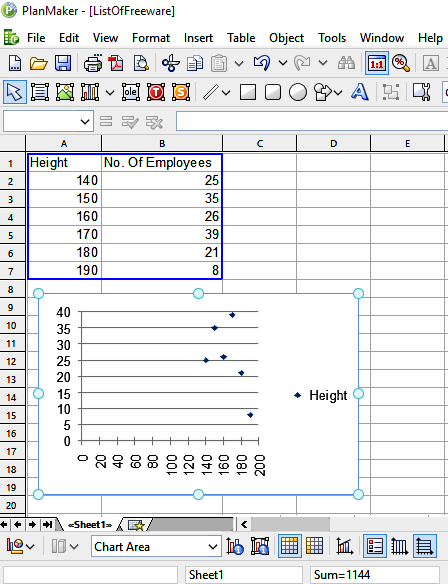
Softmaker Free Office is yet another free scatter graph maker for PC. It is basically an office suite that contains PlanMaker (similar to MS Excel), Presentation (like MS PowerPoint), and TextMaker (analogous to MS Word).
To get scatter graph for your data, you need to launch PlanMaker and provide dataset as input. Now, go to Object menu and select New Chart Frame option. After that, select Chart Type as XY Scatter and choose its suitable sub-type from the right part of the application window. Some of the sub-types are XY scatter with/without lines, XY Scatter with interpolated lines, XY scatter with interpolated lines only, etc. As you select the sub-type, the corresponding preview of the scatter graph is generated on the right part of the interface.
As the graph appears on the screen, you can adjust its position and size. Moreover, to make graphs more attractive, you can customize graph by selecting an available color palette, such as Excel 2010’s black, blue, green, purple, etc.
After completion of scatter graph visualization, you can save the complete file in XLS, CSV, PMDX, PMV, XLT, etc. formats. Also, it lets you save the graph as image in PNG, BMP, GIF, BMP, etc. formats.
Note: To use this software, you need to enter the product key (free) provided through registered E-mail.
IBM Lotus Symphony
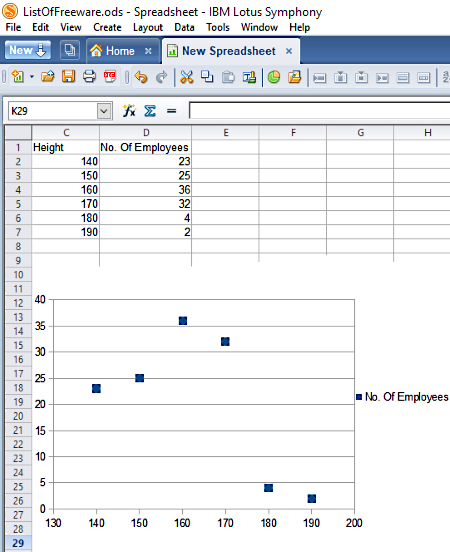
IBM Lotus Symphony is one more alternative to a free scatter graph maker software for Windows. It provides services namely, Document, Presentation, and Spreadsheet that are analogous to MS Word, Powerpoint, and Excel, respectively.
To create scatter plot, you can either open any Excel file or create a new one by making entries to its Spreadsheet. After that, go to Create (menu) > Chart (option) and select chart type as XY (Scatter). As you click on desired chart type, you can access its many other sub-types and a click on Finish button makes the graph appear in the spreadsheet.
Like many other software, it also lets you define data range and customize data ranges for individual data series. Also, you can define title, subtitle, X-axis, Y-axis, etc. by using Chart Elements option.
To save data and associated scatter graph, you can use either of these supported formats: ODS, OTS, SXC, STC, XLS, XLT, or CSV. Moreover, it also lets you print the same as PDF.
In addition to scatter graphs, you can also use this software to create Column, Bar, Line, Area, Pie, Net, etc. graphs.


About Us

We are the team behind some of the most popular tech blogs, like: I LoveFree Software and Windows 8 Freeware.
More About UsArchives
- May 2024
- April 2024
- March 2024
- February 2024
- January 2024
- December 2023
- November 2023
- October 2023
- September 2023
- August 2023
- July 2023
- June 2023
- May 2023
- April 2023
- March 2023
- February 2023
- January 2023
- December 2022
- November 2022
- October 2022
- September 2022
- August 2022
- July 2022
- June 2022
- May 2022
- April 2022
- March 2022
- February 2022
- January 2022
- December 2021
- November 2021
- October 2021
- September 2021
- August 2021
- July 2021
- June 2021
- May 2021
- April 2021
- March 2021
- February 2021
- January 2021
- December 2020
- November 2020
- October 2020
- September 2020
- August 2020
- July 2020
- June 2020
- May 2020
- April 2020
- March 2020
- February 2020
- January 2020
- December 2019
- November 2019
- October 2019
- September 2019
- August 2019
- July 2019
- June 2019
- May 2019
- April 2019
- March 2019
- February 2019
- January 2019
- December 2018
- November 2018
- October 2018
- September 2018
- August 2018
- July 2018
- June 2018
- May 2018
- April 2018
- March 2018
- February 2018
- January 2018
- December 2017
- November 2017
- October 2017
- September 2017
- August 2017
- July 2017
- June 2017
- May 2017
- April 2017
- March 2017
- February 2017
- January 2017
- December 2016
- November 2016
- October 2016
- September 2016
- August 2016
- July 2016
- June 2016
- May 2016
- April 2016
- March 2016
- February 2016
- January 2016
- December 2015
- November 2015
- October 2015
- September 2015
- August 2015
- July 2015
- June 2015
- May 2015
- April 2015
- March 2015
- February 2015
- January 2015
- December 2014
- November 2014
- October 2014
- September 2014
- August 2014
- July 2014
- June 2014
- May 2014
- April 2014
- March 2014
