7 Best Free Open Source Graphing Software For Windows
Here is a list of best free open source graphing software for Windows. These software are similar to standard graphing software through which you can draw various types of 2D and 3D graphs. The main difference is that these are open source which means you can download and make modifications to their source codes.
Using these graphing software, you can plot graphs of various types such as Line graph, Scatter Graph, Vertical Bar Graph, etc. You can also use various types of equations, functions, coordinates, etc. to draw graphs. In most software, the process of creating a graph is straightforward as you just need to provide the right equation, coordinate, etc. to get the respective graph. However, some of these are quite complex as they need multiple equations and commands to draw the right graph. In these software, you also get various analyzing tools to analyze graphs and output values. Plus, fully-fledged scientific calculators to perform complex calculations are also present in some software. Plus, various common but essential tools like Zoom in/out, Pan, Graph lines, etc. are also available. After plotting the graph, you can save it in formats like PDF, EMF, PNG, SWF, etc.
My Favorite Open Source Graphing Software For Windows:
GraphCalc is my favorite software because it can plot both 2D and 3D graphs using various mathematical equations. Plus, its ability to draw graphs of multiple equations on the same plane is also impressive. Plotting graphs using it is also comparatively easier than other similar software.
You can also check out lists of best free Line Graph Maker, Linear Equation Grapher, and Scientific Graph software for Windows.
GraphCalc
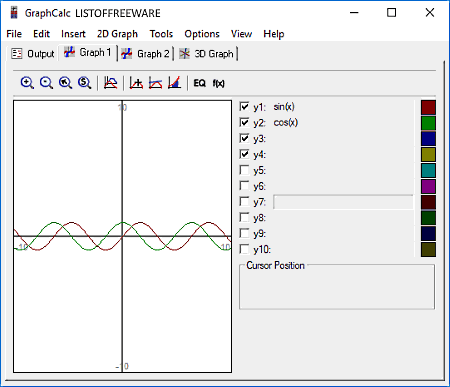
GraphCalc is a free open source graphing software for Windows. Using it, you can draw both 2D and 3D graphs of Linear, Cubic, Trigonometric, Quadratic, etc. equations. Additionally, it also provides a scientific calculator to help you solve entered equations.
This software comes with dedicated 2D and 3D graph sections. To draw a 2D graph, go to the Graph 1 tab and enter equations on available y(t) fields to immediately get the respective graph on the XY-plane. Each y(t) function is coded with a different color, to help you quickly identify the graph of a specific equation. At any time, you can change the color of a function from the Graph options. The output graph doesn’t have any markings, so to know coordinate of a point, you need to place the cursor at that place.
Similar to the 2D graph, you can also draw 3D graphs using the 3D graph tab. In this tab, you can enter equations by accessing the 3D Graph menu > Options. At maximum, you can plot graphs of 6 different equations. Some other settings like the selection of colors, range, and axis can also be changed. After the setup, press OK button to view the 3D graphs. You can easily rotate and pan the graph through mouse to view it from all angles. After obtaining the final graph, you can save it in a PDF document.
SciDAVis
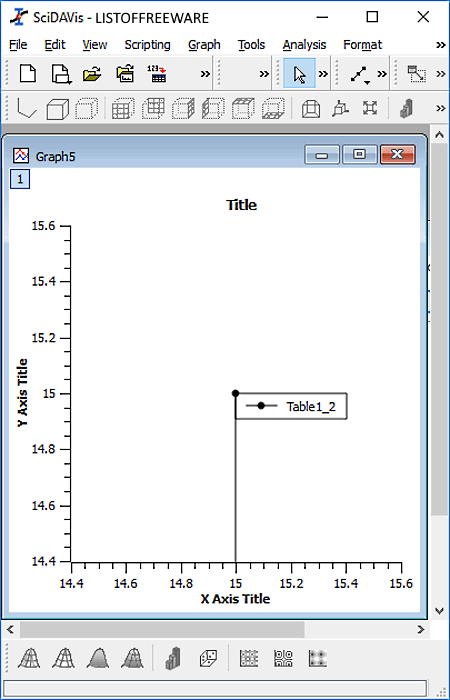
SciDAVis is a free open source graphing software for Windows. Using it, you can easily plot graphs of various types like Line graph, Scatter Graph, Vertical Bar Graph, Horizontal Bar Graph, etc. Along with standard 2D graphs, it can also plot 3D graphs of four types namely Trajectory, Bars, Scatter, and Ribbons.
In order to plot graphs, first, you need to enter the coordinates in the X and Y fields of the table. In the table, you also get a Type menu from where you can change the coordinate format to Automatic (E) or Scientific (e) values. A Formula Menu is also present in the Table to enter formulas. Now, to get the graph, just go to the Plot menu and select a graph type from various available ones to get the desired graph. To get a proper look at the graph, you can use Zoom In/Out and Best-Fit tools. After viewing the graph, you can save the graph as BMP, EPS, GIF, PDF, JPG, etc. formats.
In this software, you also get various analysis tools like Interpolate, FFT, Differentiate Integrate, etc. Plus, for 3D graphs, it provides various additional tools to change the orientation of the 3D graph such as front grid, back grid, floor grid, reset rotation, etc.
Veusz
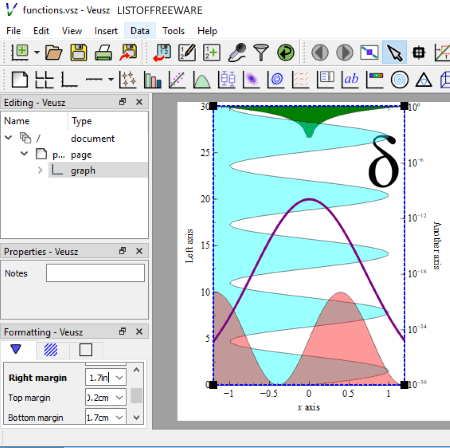
Veusz is a free open source graphing software for Windows. In it, you can plot graphs of both 2D and 3D types. It uses coordinate files as input of CSV, TXT, HDF5, and FITS formats to plot graphs. However, if you want to plot a graph based on equation, then you can directly specify your equation along with values of its variables to plot graphs.
Now to plot graphs using the coordinate file, first, you need to combine coordinate fields (X, Y, and Z) with the coordinate values of the coordinate file using the Properties field. After that, select the type of graph that you want to plot from its toolbar such as Points, Bar Chart, Function To Data, Function, Vector Field, Box Plots, etc. As soon as values of coordinate column get attached with the coordinates, you can immediately view the resultant graph. The resultant graph can easily be exported as SVG, PDF, EMF, PNG, JPG, BMP, etc. formats.
In this software, you can also create fully colored graphs by specifying different colors to different areas of the graph using the Color menu. Besides this, it also lets you add 3D elements, grid, label, shapes, etc. to existing graphs.
Graph
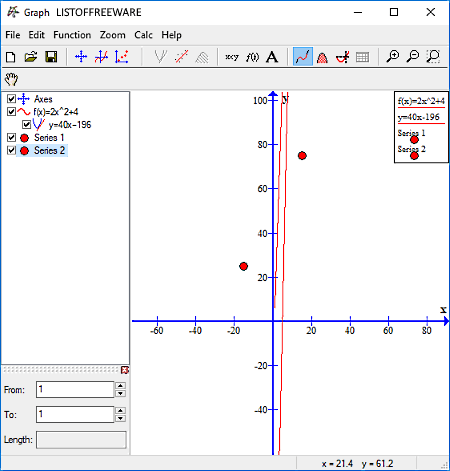
Graph is another free open source graphing software for Windows. It is used to draw graphs of various mathematical functions and equations like Linear Equations, Trigonometric Functions, Cubic Equations, etc. In it, you can draw multiple graphs on the same XY-plane by entering two or more absolutely different equations. In case of multiple equations, you can assign a color scheme for each equation to quickly identify graph lines of a particular equation. Besides color coding, there are some other handy features in it like Shading (to shade different parts of the graph), Series (to add colored dot on the graph), Label (to add text), Relation (to add relations between equations), etc.
Now, to plot graphs using equations, go to Functions menu and select Insert function. In Insert Function, you get a Function equation field in which you can enter one equation at a time. Color coding option is also available in this menu, so select a color for the entered equation and click on OK button to view the graph on XY plane. Repeat the same process again to plot multiple graphs by entering more equations. After completion, you can save the final graph in various formats like SVG, BMP, JPG, PNG, etc.
Xcas
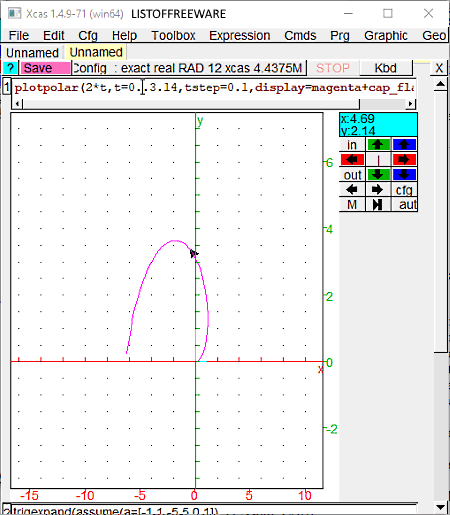
Xcas is a free and open source computer algebra system for Windows that can also be used as a graphing software. Using it, you can plot graphs of various mathematical expressions related to Trigonometry, Exponential, Rational Expression, Real Expression, etc. Plus, it also provides an additional Cmds menu to add logical commands to the equation. In the Cmds menu, you get multiple commands like hbitand, bitor, re, im, abs, cross, and more representing Constants, Integers, Intervales, etc. of equations. After creating an equation using the expressions and commands, go to its graph menu to plot various different types of graphs such as 3D, Curved, Surface, Sequence, etc. After plotting the graph, you can either save all the parameters along with the graph as SWF file or you can only export graph parameters as xcas text, maple, text, mupad text, etc. files.
Apart from graphs, you can also use it to create advanced interactive geometry spreadsheet and as a high-end graphics calculator. Overall, it is a complex open source graphing software for advanced users.
gnuplot
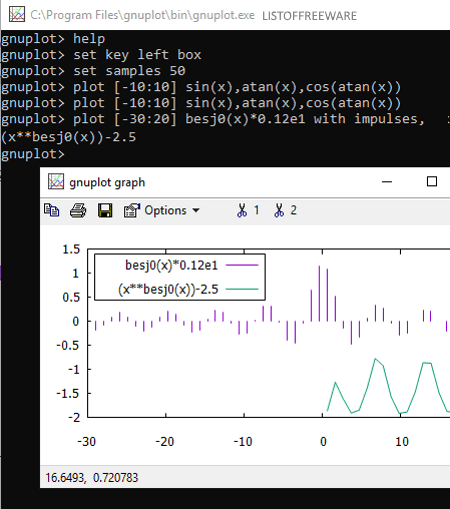
gnuplot is a completely free and open source graph plotting software for Windows. It is DOS based graphing software through which you can plot both 2D and 3D graphs using expressions, functions, and equations. In terms of expressions, you can use complex number, unary, binary, logical operator, etc. to draw graphs. If you want to draw graphs using functions, then you need to use either Elementary (absolute, integer, floor, ceiling, sqrt, etc.) or Special (inv error, gamma, igamma, lgamma, etc.) functions.
To plot graphs, you need to enter the command in this format plot [-10:10] sin(x), atan(x), cos(atan(x)). After entering the command, just press enter to get the graph. Unlike its interface, the output graph is open in a graphical interface. From its interface, you can analyze the output graph line of one variable at a time by hiding graph lines of other variables. After analyzing the graph, you can save it as EMF file and as PDF.
Functy
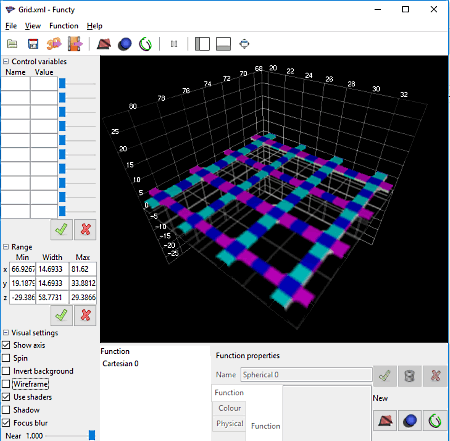
Functy is the next free open source graphing software for Windows. Using it you can plot 3D graphs of cartesian, spherical, and curve functions. In this software, you don’t get standard 3D graph, instead, it provides graphs in form of 3D drawings covered with various colors without showing the internal graph structure.
To create a graph, first, you need to enter a function on its Function field. After that, specify the control variables if any in it Control variables field. Now, go to the range field and specify the minimum and maximum coordinates values within which you want your graph. Lastly, click on the green tick button to view the graph. You can move and rotate the graph with ease to view all angles and sides of the graph. Besides this, a handy Visual settings section is also provided by it from where you can enable features like shaders, shadow, focus blur, spin, invert background, etc. The final graph can be saved as animation (PLY and STL) as well as in standard graph formats like PNG, VDB, PTL, etc. formats.


Naveen Kushwaha
Passionate about tech and science, always look for new tech solutions that can help me and others.
About Us

We are the team behind some of the most popular tech blogs, like: I LoveFree Software and Windows 8 Freeware.
More About UsArchives
- May 2024
- April 2024
- March 2024
- February 2024
- January 2024
- December 2023
- November 2023
- October 2023
- September 2023
- August 2023
- July 2023
- June 2023
- May 2023
- April 2023
- March 2023
- February 2023
- January 2023
- December 2022
- November 2022
- October 2022
- September 2022
- August 2022
- July 2022
- June 2022
- May 2022
- April 2022
- March 2022
- February 2022
- January 2022
- December 2021
- November 2021
- October 2021
- September 2021
- August 2021
- July 2021
- June 2021
- May 2021
- April 2021
- March 2021
- February 2021
- January 2021
- December 2020
- November 2020
- October 2020
- September 2020
- August 2020
- July 2020
- June 2020
- May 2020
- April 2020
- March 2020
- February 2020
- January 2020
- December 2019
- November 2019
- October 2019
- September 2019
- August 2019
- July 2019
- June 2019
- May 2019
- April 2019
- March 2019
- February 2019
- January 2019
- December 2018
- November 2018
- October 2018
- September 2018
- August 2018
- July 2018
- June 2018
- May 2018
- April 2018
- March 2018
- February 2018
- January 2018
- December 2017
- November 2017
- October 2017
- September 2017
- August 2017
- July 2017
- June 2017
- May 2017
- April 2017
- March 2017
- February 2017
- January 2017
- December 2016
- November 2016
- October 2016
- September 2016
- August 2016
- July 2016
- June 2016
- May 2016
- April 2016
- March 2016
- February 2016
- January 2016
- December 2015
- November 2015
- October 2015
- September 2015
- August 2015
- July 2015
- June 2015
- May 2015
- April 2015
- March 2015
- February 2015
- January 2015
- December 2014
- November 2014
- October 2014
- September 2014
- August 2014
- July 2014
- June 2014
- May 2014
- April 2014
- March 2014
