6 Best Free Econometric Software For Windows
This article contains a list of best free econometric software for Windows. Using these free software, you can create, study, and analyze economic data using various econometric models. You can know more about econometrics from this link. Coming back to econometric models and techniques, these include ARIMA, MIDAS, Univariate GARCH models, VARs and VECMs, Unit-Root and Cointegration tests, Kalman Filter, Smooth Transition Regression models, ARCH models, etc. There are various estimator models like least squares, simultaneous equation system, robust estimation, maximum likelihood, nonlinear least squares, GMM, etc. are also provided in these econometric software.
To add datasets, you can create new ones with tables, matrices, variables, etc., or you can also import datasets from files in formats like XLS, ODS, TXT, CSV, etc. Some of these provide inbuilt project templates which you can use to study econometrics. These software let you visualize data on graphs like histograms, scatterplot, bar chart, etc. Results including descriptive statistics, autocorrelation function, correlation table, distribution function, normal PP-diagram, spectrogram, etc. are provided to let researchers perform in-depth econometric study.
My Favorite Free Econometric Software For Windows
gretl is my favorite econometric software because it provides a good number of econometric models to study. You can also plot graphs and save them in this software. JMuTi is also good for the analysis of time series data.
You may also like some best free Statistical Analysis Software, Data Visualization Tools, and Laplace Transform Calculators for Windows.
gretl
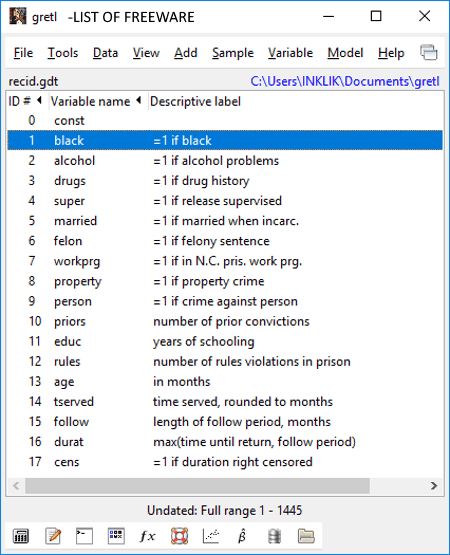
gretl is a free open source econometric software for Windows. It provides a variety of tool to analyze economic data. You can create new data set or import relevant data from different files such as CSV, ASCII file, XLS, XLSX, ODS, and other econometric software files like Stata files, Eviews files, JMulTi files, Octave files, etc. Some sample data files are also provided for econometric study. For example, Euro area money demand data, unionization of workers in the US, test data for Poisson regression, pension plan participation, interest rates and inflation, etc.
A variety of estimator models including least squares, simultaneous equation system, robust estimation, maximum likelihood, nonlinear least squares, GMM, etc. Different methods for time series analysis are also provided in it such as ARIMA, MIDAS, univariate GARCH models, VARs and VECMs, unit-root and cointegration tests, Kalman filter, etc. You can find more tools to perform in-depth econometric analysis including Statistical tables, P-value finder, Distribution graphs, Plot a curve, Test statistics calculator, Nonparametric tests, and Seed for random numbers. The time series graph, XY scatter plot, boxplot, 3D plot, Q-Q plot, etc. can be viewed, printed, and saved as PNG, EMF, EPS, PDF, etc. files. You can also view summary statistics, correlation matrix, cross tabulation, principal components, Mahalanobis distance, and cross-correlogram.
Overall, gretl is one of the best econometric software. It also supports scripts like Gnuplot script, R script, Octave script, Python script, Stata program, etc. You can also set general program preferences and share data via email. To check a detailed review of gretl, check here > gretl Review on ILoveFreeSoftware.com.
JMuTi
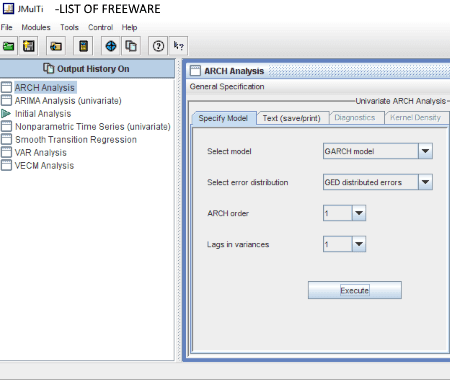
JMuTi is basically a free econometric software to analyze univariate and multivariate time series. To import dataset for analysis purpose, it supports XLS, MAT, Gauss Datasets (DAT), Gauss Matrix Files (FMT), etc. It provides different modules for the whole time series analysis. Its Initial Analysis module provides the starting point for time series analysis. From this module, you can plot a time series, get statistics table, create crossplot of two different variables, estimate kernel density, view spectrum, etc. It provides various Unit Root Tests procedures including ADF Test, KPSS Test, Schmidt-Phillips Test, HEGY Test, and UR with Structural Break. Cointegration Tests including Johansen Trace Tests and Saikkonen & Lütkepohl Tests can also be performed. You can configure and view residual analysis too.
It provides different statistical models for the analysis of time series data. These include VAR models, VECM models, ARCH models, Smooth Transition Regression models, Univariate nonparametric time series models, and Univariate ARIMA models. You can specify, estimate, check, perform structural analysis, and forecast these models.
The visualization of analyzed data is provided as various graphs. The plotted graphs can be copied as Bitmap or Metafile. You can convert the graphs to Enhanced Metafile, Encapsulated Postscript, HPGL Plotter, and Windows Bitmap files. Some plot settings can be customized such as axis labels, legend settings, title preferences, etc. It provides separate TS Calculator (Time Series Calculator), Symbol Control, Output Control, etc. options too.
In general, it is another one of useful econometric software which provides essential and some advanced tools to study economic data.
SHAZAM
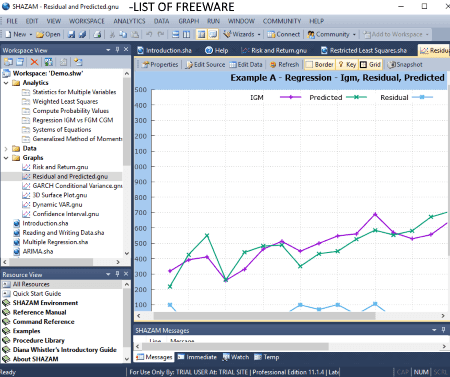
SHAZAM is another econometric software for Windows. Its trial version can be used for free for an unlimited time period as mentioned on its official website. The limitation of this free version is that the amount of memory for calculation purpose is limited.
Now, coming to its functionalities, it is quite a feature-rich econometric analysis software. To get started with, a demo workspace with sample data and analysis results is provided so that users can get familiar with the working of this software. You can create your own workspace by importing data files (SHAZAM files, CSV, PRN), inserting datasets or matrices, generating variables, using data connectors, etc. It provides various analytics and estimation models which are used for the econometrics study. These include Descriptive Statistics, Ordinary Least Squares, Generalized Least Squares, Nonlinear Regression, Distributed-Lag Models, Probit Regression, Logit Regression, Tobit Regression, etc. It provides more statistical models including ARIMA Model, System of Equations, Two Stage Least Squares, Three Stage Least Squares, Instrumental Variable Estimation, Heteroskedastic Models, Autocorrelation Models, Cointegration and Unit Root Tests, etc. Various graph and plot options are also provided to visualize economic data. The plot or graph can be saved as a PNG, BMP, or TIF image.
This is another good econometric software for Windows users. It provides various compact windows so that you can easily navigate to different aspects of a project. You can find an elaborative user guide in case you find difficulty in operating this software.
Matrixer
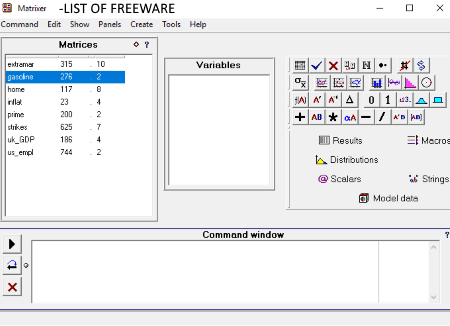
Matrixer is one more free econometric software which is basically created to teach econometrics. It provides a wide number of econometric models to study. These include the following techniques:
- Regressions: Linear regression, Logit/probit, Instrumental Variable Methods, Ordered regression, Quantile regression, Regression with count dependent variable, Regression with limited dependent variables.
- ARIMA, GARCH: Regression with GARCH error, Regression with ARMA error, Box-Jenkins model (ARIMA), ARFIMA-FIGARCH, etc.
- Nonparametric Estimation: Nonparamtetric regression and Nonparamteric density estimation.
- System Estimation: Simultaneous equations and Vector autoregression.
You can create matrices and perform various matrix related operations including create vector, transpose, invert, sum, matrix product, subtract, multiply by scalar, direct product, direct division, etc. The economic data can be imported from files in formats like TXT, DAT, CSV, XLS, etc. formats. As results, it provides descriptive statistics (mean, variance, etc.), data plots, 3D plot, histogram, scatter graph, XY plot, spectral density estimate, autocorrelation function, correlation table, distribution function, normal PP-diagram, spectrogram, etc. You can also plot functions according to formulas. It provides Dickery-Fuller test (ADF) option too. A command window is also provided to enter and execute commands.
In this software, the plotted graphs can be saved as Bitmap, Metafile, JPEG, PNG, or GIF file. Before that, you can set some general graph settings like font, legend, X axis, Y axis, etc. and change the graph style too.
PSPP
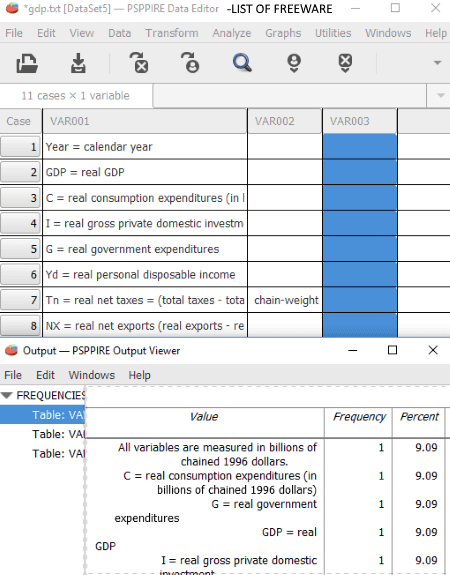
PSPP is another free software which lets you analyze and study economic statistics. You can import relevant files in TXT, CSV, XLS, ODS, etc. formats, or you can even prepare new data files. For that, you can define variables and enter data. It provides different menus to carry econometrics study, which are as follows:
- Transform: You can compute variable using different functions, count occurrences of values within cases, rank cases, etc. using this menu.
- Analyze: The core analysis models are available here which include descriptive statistics, compare means, univariate analysis, bivariate correlation, K-means cluster, factor analysis, reliability, regression, non-parametric statistics, and ROC curve.
- Graphs: You can view statistical data in the form of scatterplot, histogram, and bar chart.
All in all, it is another nice econometric analysis software for researchers.
Draco Econometrics
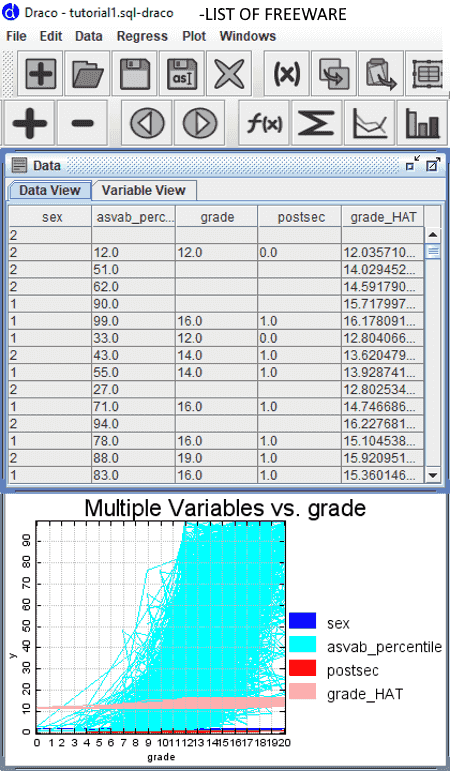
Draco Econometrics is a free open source econometric software for Windows. It lets you create or import dataset from Text, ODS, XlS, etc. files. You can create time series or panel data using various options like Column Operations, Row Operations, Sheet Operations, etc. It provides various techniques to study econometrics. These econometric models include Least Squares Fit, Two-Stage Least Squares, Logit Regression, Probit Regression, Nonlinear Least Squares, and Weighted Least Squares. To visualize data, you can plot column data and histogram. The data can be viewed in data or variable view.


About Us

We are the team behind some of the most popular tech blogs, like: I LoveFree Software and Windows 8 Freeware.
More About UsArchives
- May 2024
- April 2024
- March 2024
- February 2024
- January 2024
- December 2023
- November 2023
- October 2023
- September 2023
- August 2023
- July 2023
- June 2023
- May 2023
- April 2023
- March 2023
- February 2023
- January 2023
- December 2022
- November 2022
- October 2022
- September 2022
- August 2022
- July 2022
- June 2022
- May 2022
- April 2022
- March 2022
- February 2022
- January 2022
- December 2021
- November 2021
- October 2021
- September 2021
- August 2021
- July 2021
- June 2021
- May 2021
- April 2021
- March 2021
- February 2021
- January 2021
- December 2020
- November 2020
- October 2020
- September 2020
- August 2020
- July 2020
- June 2020
- May 2020
- April 2020
- March 2020
- February 2020
- January 2020
- December 2019
- November 2019
- October 2019
- September 2019
- August 2019
- July 2019
- June 2019
- May 2019
- April 2019
- March 2019
- February 2019
- January 2019
- December 2018
- November 2018
- October 2018
- September 2018
- August 2018
- July 2018
- June 2018
- May 2018
- April 2018
- March 2018
- February 2018
- January 2018
- December 2017
- November 2017
- October 2017
- September 2017
- August 2017
- July 2017
- June 2017
- May 2017
- April 2017
- March 2017
- February 2017
- January 2017
- December 2016
- November 2016
- October 2016
- September 2016
- August 2016
- July 2016
- June 2016
- May 2016
- April 2016
- March 2016
- February 2016
- January 2016
- December 2015
- November 2015
- October 2015
- September 2015
- August 2015
- July 2015
- June 2015
- May 2015
- April 2015
- March 2015
- February 2015
- January 2015
- December 2014
- November 2014
- October 2014
- September 2014
- August 2014
- July 2014
- June 2014
- May 2014
- April 2014
- March 2014
