6 Best Free Bioinformatics Software For Windows
Here is a list of best free bioinformatics software for Windows. Using these software, you can view and analyze biological data like sequences of DNA, RNA, etc. The biological data that you analyze comes from various species like aptMan, Bos taurus, Gorilla, etc. To analyze a particular genome, you need to either use the supported database or provide a sequence file. Sequence files can be of various types like .mga, .txt, .pir, etc. You can easily view the sequence contained in input files on the interface of these software to clearly understand and analyze the sequence in terms of function, structure, evolution, etc. Most software use color codes to mark sequences consist of the same element. Besides this, there are many other viewing and analyzing tools that you can use including zoom in/out, 3D structure view, Tree diagram, etc.
If you have sufficient knowledge of genetic sequences, you can also edit sequences with ease using these bioinformatics software. In sequence editing, you can change characters of sequences, change color coding of sequences, add annotations, etc. After modification, you can also choose to save the modified version of sequences in TXT, XLX, GB, etc. file formats.
My Favorite Bioinformatics Software For Windows:
Integrated Genome Browser is my favorite software from this list because it lets you browse genome codes of many species from its interface. Plus, it also lets you manually add and view genome code files. I also find it a very user-friendly software through which you can effortlessly view and analyze genome codes.
You can also check out lists of best free Ecosystem Software, Phylogenetic Tree Viewer, and Genetic Heredity Calculator software for Windows.
Integrated Genome Browser
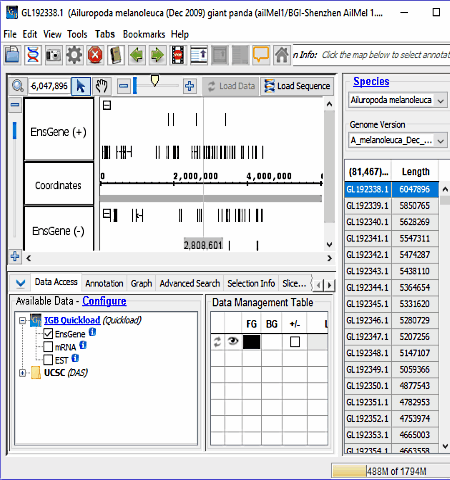
Integrated Genome Browser is a free, open-source bioinformatics software for Windows. This software is mainly used to view and analyze big genomic datasets. This software itself comes with genome sequences of many species like Apis mellifera, aptMan, Bos taurus, Gorilla, and more. Every species has a different number of genome sequence and length that you can easily select and analyze using this software. Besides this, you can also open genome file and genome file URL links to view and analyze external genomic data sets as well.
How to analyze genomic datasets using Integrated Genome Browser:
- First, choose Specimen and Genome version from the Species section.
- Open data sets from remote data sources (Data Access tab) or by opening local files. When you select a data set or file, this software will add a new empty track to the main view and list it in the Data Management table.
- Now, press the Load button and view all the genome codes. Here, you also get tools like zoom in/out just above the code viewer to help you analyze the complex codes better.
- At last, you can configure tracks by reordering the tracks. To customize tracks, you can use annotation and graph tabs to change color, track height, annotation label, amount of data shown (stack height), and other options.
All the modifications performed by you on the genome code and their tracks can be saved as PNG, SVG, and JPEG files. Overall, it is one of the easiest software to analyze genomic datasets.
MEGA
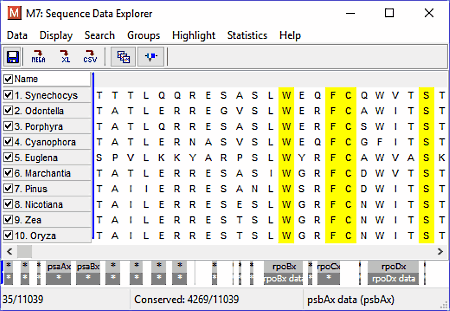
MEGA is a free and user-friendly bioinformatics software for Windows. This software is mainly used to analyze protein and DNA sequence data from species and population. Using it, you can also perform various types of sequence analysis like Phylogeny Interference, Model Selection, Dating and Clocks, Sequence Alignment, etc. Plus, various important Statistical methods (distance method, maximum likelihood method, etc.) and Powerful visual tools (tree explorers, data explorers, etc.) are also available. All of these impressive tools and features allow you to analyze the input DNA and Protein sequence thoroughly.
In this freeware, you can input DNA and Protein sequence as a Text file (.txt) or as MEGA (.mga) file. After submitting the file, you can view and analyze data by using various available menus. Let’s take a brief look at how these menus work.
- TA DATA: Using this menu, you can view the input sequence in the form of symbols like T, L, Q, R, etc. Each symbol has a specific meaning and to highlight a specific type of symbol, you can use tools like C (mark conserved sites), V (mark variable sites), etc.
- Models: It is a very important menu using which you can find best DNA/protein model, estimate substitution matrix, compute amino acid composition, compute pattern disparity index, and more.
- Distance: It is used to find out sequence pairwise distance, overall mean distance, etc.
- Phylogeny: Though this tab, you can convert input sequence into maximum likelihood tree, neighbor-joining tree, minimum evolution tree, etc.
- User Tree: It is used to analyze input data using different types of user trees like Least Squares and Parsimony.
Apart from these important features, you can find some other additional menus to accomplish a variety of tasks. The resultant graphs and reports provided by this software can be saved as Newick (.nwk) file format.
UGENE
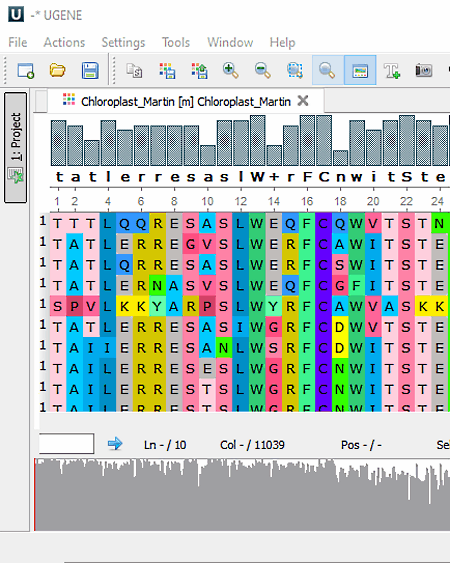
UGENE is another free and open-source bioinformatics software for Windows. In this software, you can create, edit, annotate, and analyze nucleic acid and protein sequences. Plus, this software comes with built-in support for various databases like NCBI, PDB, ENSEMBL, etc., from where you can download various sequences. In this software, you can also find a lot of analysis tools like Sanger data analysis, NGS data analysis, BLAST, multiple sequence alignment, Cloning, HMMER tools, etc. Most of these analysis tools work with both local sequences as well as with database sequence that you can download using URL.
How to analyze nucleic acid and protein sequence using this software:
- Add sequence file (ACE, BAM, GFF, GTF, MMDB, SAM, Raw sequence, NEXUS, etc.) by using its File menu. Sequence present in the file will automatically open on the main interface.
- In the available sequence, you can notice that this software automatically draws similar symbols of different species in the same color. This color scheme comes in handy to identify the symbols or codes of different species which are same. This color scheme can also be changed by changing the color type to Clustal X, Helix Propensity, Strand Propensity, etc.
- Use various available tools like Zoom in/out, alignment, statistics, etc. to closely analyze the sequence.
After the analysis, you can export the sequence data in PNG, BMP, JPG, TIFF, and SVG format.
UGENE is another good bioinformatics software for Windows with a straightforward interface.
Jalview
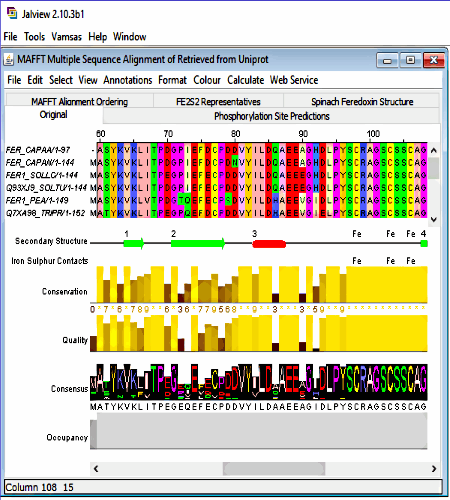
Jalview is yet another free bioinformatics software for Windows. Using it, you can view and edit sequence alignments, analyze sequence with principal component analysis (PCA) plots with phylogenetic trees, and explore molecular structures and annotations. This software also comes with built-in DNA, RNA, protein sequence, and structure visualization and analysis capabilities. Plus, some handy tools like Jmol to view 3D structures, VARNA to display RNA secondary structure, etc. are also available.
In this software, you can add sequence by directly writing it, by adding a sequence file URL, or by submitting a sequence file of supported format (PFAM, PIR, JSON, BLC, etc.). As soon as you enter a sequence, this software will automatically open a tree view, 3D structure view, and multiple sequence alignment windows to view, align, and analyze the sequence. In this bioinformatics software, you can also notice that every change in sequence alignment directly affects the 3D structure in real time to help you quickly analyze the sequence.
Apart from main analysis tools, you can find many other handy tools in this software like color (to change color pattern of sequence manually), Annotations (to show or hide various helpful sequence annotations), Calculate (to calculate pairwise alignment, auto-calculate consensus, show flanking regions, etc.), and more.
Overall, it is feature packed software through which you can easily analyze and study various bioinformatics sequences of multiple species with ease.
CLC Sequence Viewer
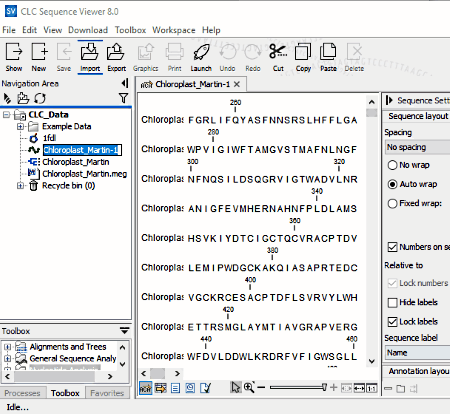
CLC Sequence Viewer is another free bioinformatics software for Windows. Through this software, you can make a large number of bioinformatics analysis using various inbuilt tools. Besides this, some excellent graphical viewing and output options are also available. This freeware comes with various features through which you can perform tasks like create and edit alignments, work with interactive restriction site analysis, phylogenetics, advanced DNA to protein translation, etc. In addition, you can also use the integrated GenBank search options and many other features to search and analyze right set of sequences.
In this software, you can input DNA, RNA, or protein sequence either by directly searching from NCBI database or by using local sequence files of various formats (zip, .gz, .clc, .cm5, etc.). The data of the imported sequence can be viewed, edited, and analyzed from the interface. Here, you can also analyze multiple sequences at once by using the multi-tab interface. On the right side of interface, various handy sequence settings, annotation settings, residue color settings, etc. are available to make modifications to the sequence.
After annotating the sequence, you can save the modified sequence in various formats like PDF, GeneBank (gb), ZIP, Excel (xls), HTML, etc.
In general, it is quite a simple software to view, edit, and analyze gene sequences.
Genbeans
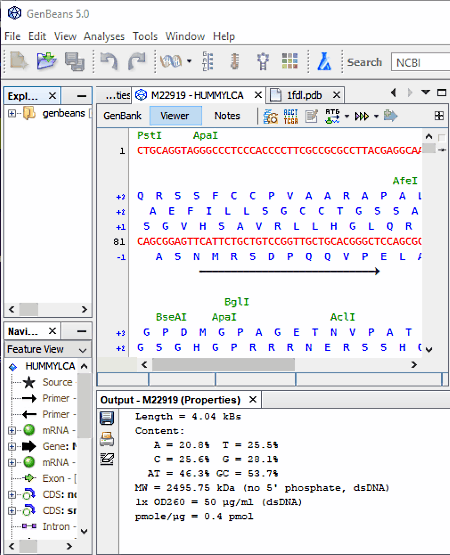
Genbeans is a free standalone bioinformatics software for Windows. It is a highly integrated platform for bioinformatics. The program is focused on molecular biology and provides a seamless work experience to researchers. Plus, it comes with a fully-integrated toolbox with a rich, user-friendly, and graphical interface for analyzing and viewing sequences.
In this software, you can open a sequence file of text, PDB, and another supported sequence format. Not just one but multiple sequence files can also be viewed in it due to its multiple tab interface. Sequence data of all files can be viewed on its editor window. Now to analyze the data, you can use the Analyses tab. Through this tab, you can list Nucleic acids (reverse complement, inverse, raw sequences, etc.), analyze ORF’s (List and MAP ORF’s), do Restriction Analysis (all sites, unique sites, absent sites, etc.), and more. The result of all analysis can be viewed in the Output section.
Besides sequence analysis, modifications on sequence file can also be performed by changing the sequence manually. After analysis and modification, save all the edited and analyzed sequence file as a text file or in their native file formats.
Naveen Kushwaha
Passionate about tech and science, always look for new tech solutions that can help me and others.
About Us
We are the team behind some of the most popular tech blogs, like: I LoveFree Software and Windows 8 Freeware.
More About UsArchives
- May 2024
- April 2024
- March 2024
- February 2024
- January 2024
- December 2023
- November 2023
- October 2023
- September 2023
- August 2023
- July 2023
- June 2023
- May 2023
- April 2023
- March 2023
- February 2023
- January 2023
- December 2022
- November 2022
- October 2022
- September 2022
- August 2022
- July 2022
- June 2022
- May 2022
- April 2022
- March 2022
- February 2022
- January 2022
- December 2021
- November 2021
- October 2021
- September 2021
- August 2021
- July 2021
- June 2021
- May 2021
- April 2021
- March 2021
- February 2021
- January 2021
- December 2020
- November 2020
- October 2020
- September 2020
- August 2020
- July 2020
- June 2020
- May 2020
- April 2020
- March 2020
- February 2020
- January 2020
- December 2019
- November 2019
- October 2019
- September 2019
- August 2019
- July 2019
- June 2019
- May 2019
- April 2019
- March 2019
- February 2019
- January 2019
- December 2018
- November 2018
- October 2018
- September 2018
- August 2018
- July 2018
- June 2018
- May 2018
- April 2018
- March 2018
- February 2018
- January 2018
- December 2017
- November 2017
- October 2017
- September 2017
- August 2017
- July 2017
- June 2017
- May 2017
- April 2017
- March 2017
- February 2017
- January 2017
- December 2016
- November 2016
- October 2016
- September 2016
- August 2016
- July 2016
- June 2016
- May 2016
- April 2016
- March 2016
- February 2016
- January 2016
- December 2015
- November 2015
- October 2015
- September 2015
- August 2015
- July 2015
- June 2015
- May 2015
- April 2015
- March 2015
- February 2015
- January 2015
- December 2014
- November 2014
- October 2014
- September 2014
- August 2014
- July 2014
- June 2014
- May 2014
- April 2014
- March 2014


