8 Best Free CSV to Graph Converter Software for Windows
Here is a list of Best Free CSV to Graph Converter Software for Windows. Using these free software, you can visualize datasets contained in CSV spreadsheet files. To visualize CSV data, these software can plot a variety of graphs. The most common graphs that you can plot and analyze using these software are Area, Bar, Bubble, Column, Line, Column and Line, Pie, Net, Stock, and Scatter. In all of these software, you can also customize chart appearance and later export it to an image like PNG, JPG, GIF, BMP, etc.
These software are pretty easy to use in order to convert CSV to graph. You just have to import CSV file, select dataset, and then use the direct option to plot graph. In case you find difficulty in generating graphs, I have mentioned the exact steps to do the same. Besides generating graphs, you can also evaluate dataset using various mathematical functions like logical, financial, statistical, engineering, database, etc.
As most of these are basically spreadsheet software, you can create or edit spreadsheets in multiple formats like XLS, XLSX, ODS, TXT, DBF, etc. You get more additional tools in these software which include data filter, sort data, create a pivot table, encrypt spreadsheets, etc. In general, these are capable CSV to graph converters which can be used for a lot more other utilities.
My Favorite Free CSV to Graph Converter Software for Windows:
SciEnPlot is one of my favorite software to graph CSV data as it provides a variety of graphs to plot as well as offers various calculation options.
If you are a user of LibreOffice software, then you can use its LibreOffice Calc application to plot CSV data using various graphs.
You may also like some best free Data Visualization Tools, Graph Analysis Software, and Open Source Graphing Software for Windows.
SciEnPlot
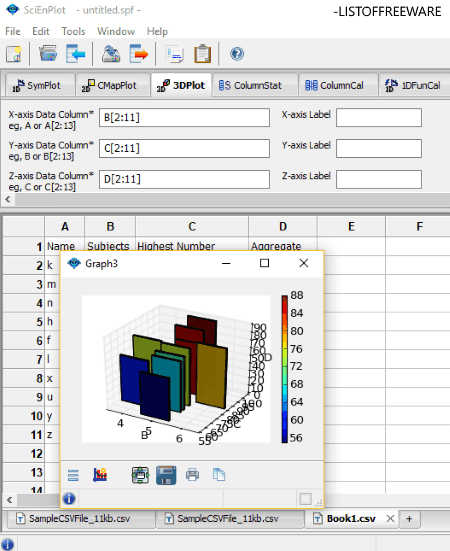
SciEnPlot is a free open source CSV to graph converter software for Windows. It can graph CSV files using different types of plot including the following:
- Symbol plots: You can plot different symbol graphs like bar, bowtie, checkmark, circle, cross X, line, pentagon, hexagon, vline, etc.
- ColorMap surface: It lets you plot color map graphs in different types such as bar, contour, line scatter, scatter, pie, surface, etc.
- 3D plot: You can plot a 3D graph in styles like bar, surface, scatter, line fill, etc.
How to graph CSV file using this open source software:
At first, go to File > Import Data and open a CSV file. It shows the spreadsheet data on the interface. Now, move to the tab for the kind of graph you want to plot. For example, if you want to generate symbol charts, go to SymPlot tab. You then need to specify columns with data range to plot, axis label, symbol type, graph panel, and symbol color. When you are done configuring these parameters, click on the Plot button to visualize the numerical dataset.
It lets you configure graph settings like label, font, legend location, etc. You can save plotted graph as images like PNG, PS, EPS, EMF, JPG, SVG, TIFF, etc.
Additional Features:
- It can also compute statistics of a selected column such as sum, minimum, maximum, mean, median, standard deviation, P value, chi-square, etc. Additionally, it also plots a histogram for computed column statistics.
- You can compute statistics using column values by applying different mathematical functions and add the results to the spreadsheet.
- It provides features for 1D and 2D function calculation with plot.
- You can evaluate Least Square Nonlinear Curve Fitting problem using imported dataset.
- Some more handy tools are provided in it such as Convert Matrix to XYZ Columns, Note Board, Create Custom Functions, etc.
Conclusion:
It is one of the best CSV to graph converter as it provides a variety of graphs to plot. Additionally, you can evaluate datasets using various calculations.
LibreOffice Calc
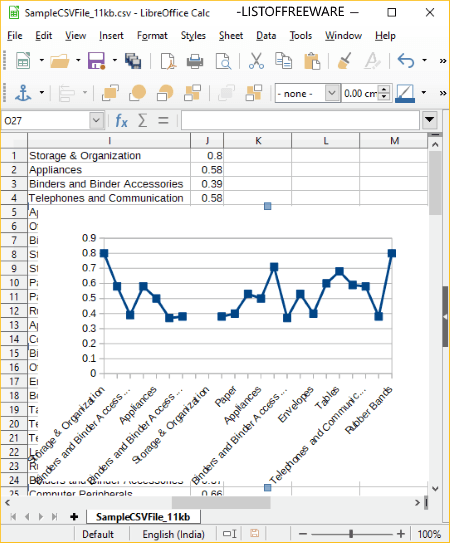
LibreOffice Calc is another free open source CSV to graph converter software for Windows. It is a part of the popular office suite called LibreOffice which is used for creating and evaluating spreadsheets. In it, you can import CSV files and then visualize the containing datasets using various graphs. It can plot different types of charts including Bar, Column, Pie, Area, Line, Bubble, Net, Stock, Column and Line, and Scatter.
Other than LibreOffice Calc, LibreOffice contains other software which are used for creating or editing documents, presentations, drawings, etc.
How to graph CSV file using LibreOffice Calc:
- Firstly, import a CSV spreadsheet using File > Open option. You can customize text import settings such as character set, language, separator options, etc.
- Now, go to Insert menu and select Chart option to open Chart Wizard.
- In the Chart Wizard, you can select the chart type, data range, data series, and chart elements (title, legends, grid) to plot CSV data.
The selected graph with customized configurations will be plotted on the spreadsheet.
An alternative to graph CSV file in it is to open CSV file, select dataset from the interface, and then insert a desired type of chart to plot using Insert > Chart option.
Features to look out for:
- It lets you enable 3D look to plot the graph.
- You can customize shape of plot based on chosen graph. For example, for bar and column graph, you can select cylinder, cone, or pyramid shape.
- You can customize graph appearance by editing Chart Wall properties such as border, area, color, width, transparency, gradient, pattern, transparency, hatch, etc.
- It lets to save plotted graph as an image by right clicking on it. The supported formats to do so include PNG, BMP, JPG, GIF, WMF, TIF, SVG, etc.
- Some additional tools provided in this software include mathematical functions, formulas, spellcheck, protect spreadsheet, etc.
- Other than CSV, it supports spreadsheets in multiple formats such as XML, XLSX, XLS, XLT, ETT, DIF, WKS, ODS, etc.
- It also works on Mac and Linux operating systems.
- You can download its portable version to use it on the go.
Final Thoughts:
It is a popular spreadsheet software which can be used to graph CSV files with a variety of chart types.
WPS Spreadsheet
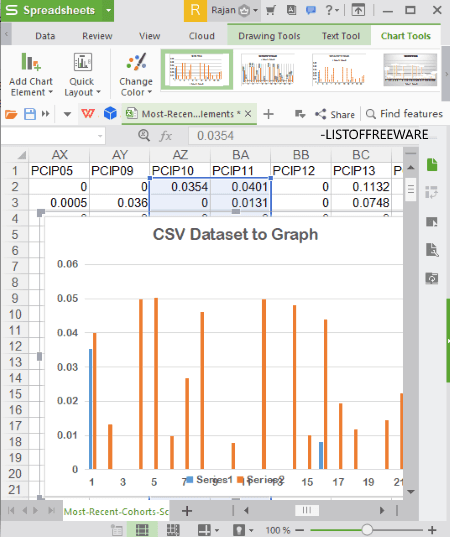
WPS Spreadsheet is another great CSV to graph converter software on this list. It lets you plot different types of graph to visualize and analyze datasets from CSV files. These chart types include Column, Line, Pie, Bar, Area, Scatter, Stock, Radar, and Combo graphs.
How to convert CSV to graph using WPS Spreadsheet:
- Import a CSV file.
- Select dataset from the spreadsheet.
- Go to Insert tab and click on Chart to select a chart type to plot.
- You can now customize the chart using options such as chart elements, chart styles, chart filters, format chart area, etc.
- You can analyze chart and even save it as a PNG, JPG, BMP, or TIF image.
Additional Features:
- It supports a lot of spreadsheet formats other than CSV, e.g., XLS, XLT, XLSX, DBF, DIF, etc.
- You can encrypt a created spreadsheet in it.
- It contains a lot of templates in its inbuilt and online libraries. To access the online library, you need to log in with the registered account.
- You can perform calculations using its Formula tab where you can find a lot of mathematical functions including logical, financial, statistical, engineering, etc.
- Tools to highlight duplicate, remove duplicate entries, consolidate data, apply filters, insert pivot table, etc., are also provided in it.
Limitations:
- The free version has some locked features, such as batch processing, additional online templates, and more.
- It contains ads in the free edition.
Conclusion:
All in all, it is a great software to graph numerical datasets contained in CSV and other spreadsheet files.
SoftMaker FreeOffice
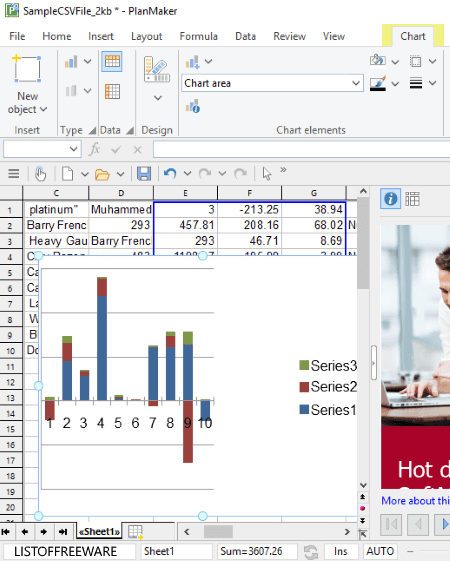
SoftMaker FreeOffice is another one of CSV to graph converters on this list. As the name implies, it is one more office software which contains a spreadsheet application named PlanMaker. This application lets you visualize CSV data with the help of various graphs. The kinds of graphs you can plot using it include bar, line, area, bubble, radar, scatter, doughnut, stock, box plot, pie, and surface.
How to plot CSV dataset using this office software:
- Open a CSV file and select the numerical data you want to plot.
- Move to Insert menu and from Chart Frame option, select the type of chart you want to generate.
- As the chart is inserted, you will be able to customize it with various options including data series, chart colors, add chart elements (title, data labels, legend, axis title, etc.), and more.
- If you wish, you can export generated graph with customized look to an image file including PNG, JPG, BMP, GIF, and TIF.
Additional Features:
- It lets you import or export spreadsheets in multiple formats including XLSX, DBF, TXT, HTML, RTF, etc.
- When you save a spreadsheet, you can even encrypt it.
- You can perform various calculations on imported dataset using multiple functions like logic, strings, financial, statistics, database, information, etc.
- You can filter data, create pivot table, sort data, etc.
Conclusion:
It is a straightforward software with a clean GUI to graph CSV files.
Gnumeric Spreadsheet
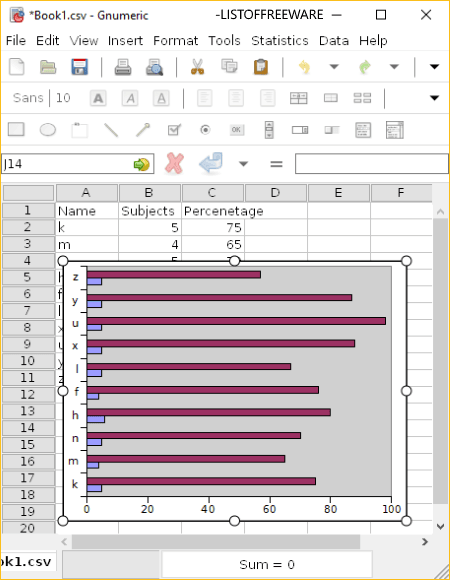
Gnumeric Spreadsheet is a nice free open source spreadsheet software which can also be used for data visualization. It lets you graph various spreadsheet files including CSV. It lets you plot a variety of charts including Area, Bar, Bubble, ColoredXY, Column, Contour, DropBar, Line, Matrix, MinMax, Pie, Polar, Radar, Ring, Statistics, Surface, and XY Scatter.
How to graph CSV file using this free software:
- Import a CSV file and click on Insert > Chart option.
- Select the dataset from the spreadsheet that you want to visualize.
- Now, choose the type of chart you want to plot and customize other settings like subtype, data series, style, theme, scale, format, etc.
- At last, click the Insert button and you will be able to view selected graph.
It allows you to save created graph as an image. The supported formats include SVG, PNG, JPEG, PDF, PS, and EPS.
Additional Features:
- You can also perform various calculations using various methods including Descriptive Statistics, Sampling, Dependent Observation, One Sample Test, Two Sample Tests, and Multiple Sample Tests.
- You get various mathematical functions to evaluate data such as Bitwise Operations, Complex, Engineering, Logic, Mathematics, Number Theory, Random Numbers, String, etc.
- You also get tools like Auto Correct, Goal Seek, Solver, Auto Save, etc., in it.
- Apart from CSV, it supports spreadsheets in formats like TSV, HTML, XLS, etc.
Conclusion:
This is another nice software to graph CSV and other file containing numerical datasets. It is an open source software; you can download its source code from here.
CSV2ScatterPlot
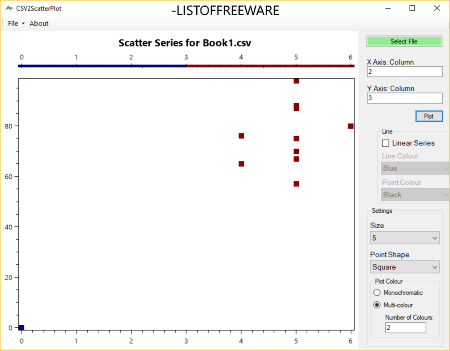
CSV2ScatterPlot is one more free CSV to graph converter software for Windows. It is a dedicated software to plot scatter and line series graphs for imported datasets.
How to create scatter graph from a CSV file:
- Open CSV2ScatterPlot and import a CSV file using the Select File button.
- Now, enter X and Y axis columns for which you want to create a graph.
- If you want to plot a linear series graph, enable the respective option from the interface. Otherwise, in case of scatter plot, leave it unchecked.
- You can customize point shape, size, point or line color, and plot color profile (monochromatic or multi color).
- Finally, click on the Plot button to view the respective graph.
If you wish, you can save the generated graph as a PNG image.
Conclusion:
It is a simple software which you can use without much hassle. You can consider this software to quickly create scatter or linear series plots from CSV files.
IBM Lotus Symphony
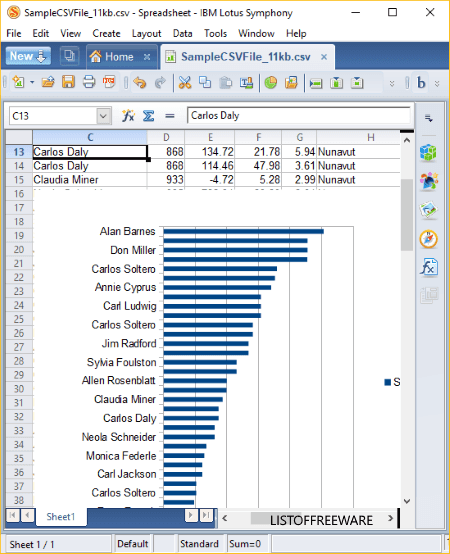
IBM Lotus Symphony is another office suite which can graph CSV files. You can plot a variety of graphs which include Column, Bar, Pie, Area, Line, Scatter, Bubble, Net, Stock, and Column and Line.
How to convert CSV to graph using IBM Lotus Symphony:
Firstly, import datasets from a CSV file and then go to Create > Chart option. Now, select chart type and specify data range, data series, and chart elements. You can apply a 3D realistic look to the chart. After specifying configurations, click on the Finish button and it will generate the graph.
You can now customize chart area and appearance with options like borders, area fill, transparency, position and size, etc.
Additional Features:
- It supports more spreadsheet formats other than CSV such as XLS, ODS, SXC, etc.
- You can password protect your spreadsheets using it.
Final Thoughts:
This is a standard office software which lets you create graphs for numerical datasets. You can also use it to create documents, spreadsheets, and presentations.
LiveGraph
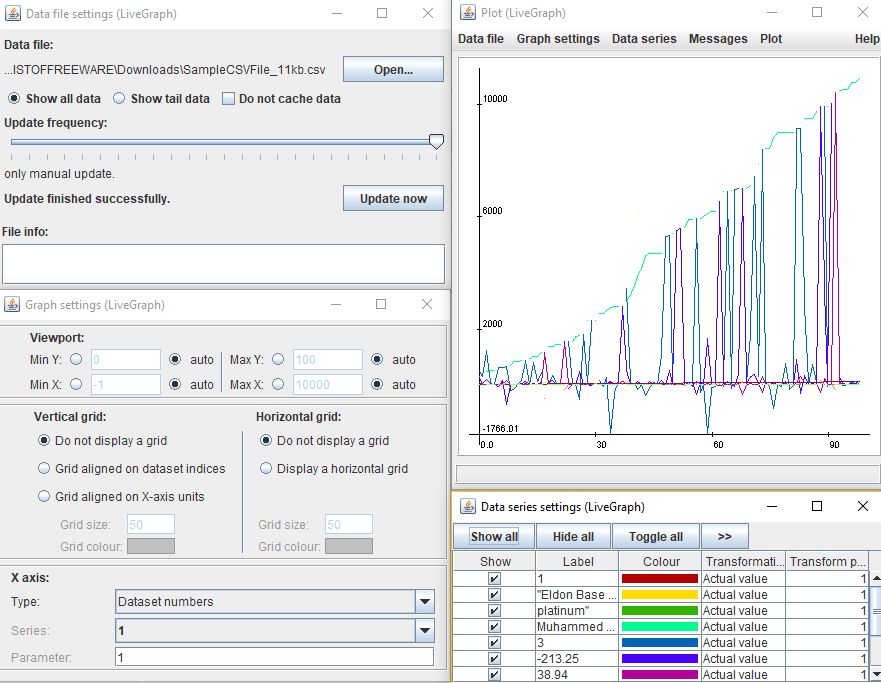
LiveGraph is a free, portable, open source CSV to graph converter software for Windows. It plots a real-time graph of numerical datasets from CSV file. For individual column, it plots graphs in different color schemes.
It is a Java-based software which needs Java to be installed in order to work.
How to convert CSV to graph using this free portable software:
In it, as you open CSV dataset file, it graphs all numerical data contained in it. You can later customize graph settings including viewport, vertical grid, horizontal grid, and X-axis. Also, you can configure dataset settings which include columns to show on plot, color, transformation (actual value, log to specified base, transform into, or scale by specified value), and transform parameter.
Additional Features:
- It lets you export plotted graph to an image in a supported format including BMP, JPEG, PNG, GIF, etc. While doing so, you can specify width and height of output graph image.
- Besides CSV, it supports generic data file i.e., .dat files in order to plot graphs.
- You can set update frequency for plotting graph.
- It is also compatible with Mac and Linux operating systems.
Conclusion:
It is a nice free software to visualize CSV data. Also, as it is portable, you can use it on the go.


About Us

We are the team behind some of the most popular tech blogs, like: I LoveFree Software and Windows 8 Freeware.
More About UsArchives
- May 2024
- April 2024
- March 2024
- February 2024
- January 2024
- December 2023
- November 2023
- October 2023
- September 2023
- August 2023
- July 2023
- June 2023
- May 2023
- April 2023
- March 2023
- February 2023
- January 2023
- December 2022
- November 2022
- October 2022
- September 2022
- August 2022
- July 2022
- June 2022
- May 2022
- April 2022
- March 2022
- February 2022
- January 2022
- December 2021
- November 2021
- October 2021
- September 2021
- August 2021
- July 2021
- June 2021
- May 2021
- April 2021
- March 2021
- February 2021
- January 2021
- December 2020
- November 2020
- October 2020
- September 2020
- August 2020
- July 2020
- June 2020
- May 2020
- April 2020
- March 2020
- February 2020
- January 2020
- December 2019
- November 2019
- October 2019
- September 2019
- August 2019
- July 2019
- June 2019
- May 2019
- April 2019
- March 2019
- February 2019
- January 2019
- December 2018
- November 2018
- October 2018
- September 2018
- August 2018
- July 2018
- June 2018
- May 2018
- April 2018
- March 2018
- February 2018
- January 2018
- December 2017
- November 2017
- October 2017
- September 2017
- August 2017
- July 2017
- June 2017
- May 2017
- April 2017
- March 2017
- February 2017
- January 2017
- December 2016
- November 2016
- October 2016
- September 2016
- August 2016
- July 2016
- June 2016
- May 2016
- April 2016
- March 2016
- February 2016
- January 2016
- December 2015
- November 2015
- October 2015
- September 2015
- August 2015
- July 2015
- June 2015
- May 2015
- April 2015
- March 2015
- February 2015
- January 2015
- December 2014
- November 2014
- October 2014
- September 2014
- August 2014
- July 2014
- June 2014
- May 2014
- April 2014
- March 2014
