7 Best Free Frequency Polygon Maker Software For Windows
Here is a list of best free frequency polygon maker software for Windows. A frequency polygon is a type of data visualization graph that is constructed by joining the midpoints of each interval. The values behind the frequency polygon graphs are obtained by calculating the midpoints of intervals from the frequency distribution table. If you already have all the necessary values, then you can use these software to quickly plot a frequency polygon graph.
All of these software are mainly office suites which come with various office modules like Presentation, Writer, Spreadsheet, Drawing, etc. From multiple available modules, you only need the spreadsheet application to create a frequency polygon. The spreadsheet program allows you to create columns representing parameters of the graphs like mid-point, frequency, etc. According to the values entered in the rows of columns, the software generates a frequency polygon graph.
To select the type of graph that you want to create, you can use the Chart section of these software. In the Chart section, you can find various types of charts and graphs like bar graphs, pie graphs, area graphs, column graphs, line graphs, etc. The most suited graph type to create a frequency polygon is the Line graph. After creating the graph, you can also adjust graph color, x-axis name, y-axis name, font, line thickness, etc.
The process of creating a frequency polygon graph is quite similar in all these software. You can find the complete frequency polygon making process in the description of each software. Go through the list to know more about these software.
My Favorite Frequency Polygon Maker Software For Windows:
LibreOffice is my favorite software because it allows you to create and adjust various parameters of the graph. In addition to that, it allows you to individually save the graph in various image formats, unlike other similar software.
You can also check out the lists of best free Graph Analysis, Line Graph Maker, and Scientific Graph software for Windows.
LibreOffice
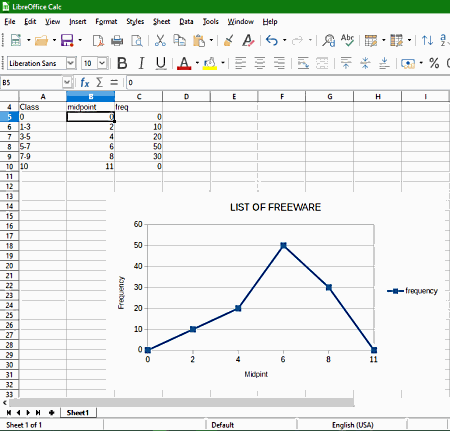
LibreOffice is a free open source frequency polygon maker software for Windows, Linux, and macOS. It is primarily an office suite that comes with multiple office software like LibreOffice Calc, LibreOffice Writer, LibreOffice Impression, LibreOffice Draw, etc. From its various available software, you only need its LibreOffice Calc software.
LibreOffice Calc is a spreadsheet-based software that contains rows and columns on its interface. You can use the columns and rows to create Midpoint and Frequency columns. The values which you will enter in the created columns will generate the frequency polygon graph. You can follow the below steps to create a frequency polygon graph.
How to create a frequency polygon graph in LibreOffice:
- Launch this software and create a new spreadsheet.
- Next, create at least two columns like Midpoint and Frequency. You can also set some other name for the columns according to the input parameters you are working with.
- After that, enter values of specified parameters in the rows of Midpoint and Frequency columns.
- Now, select all the values of parameters and go to the Insert tab and then select the Chart menu. From the Chart menu, select Points and Lines graph.
- After that, press Next to move to the Data Range section and then specify the data range for the graph.
- Again, press the Next button to go to the Data Series section in which you need to specify the range of Y-axis value and its category.
- Click the Next button one more time and give a frequency polygon title, subtitle, x-axis name, and y-axis name.
- Lastly, click on the Finish button to view the frequency polygon graph.
You can export the frequency polygon graph in image formats like PNG, JPG, GIF, BMP, EMF, etc. You can also save both the graph and spreadsheet in formats like ODF, XLS, CALC, CSV, etc.
Additional Features:
- Protect Sheet: It allows you to password protect spreadsheets with sensitive data so that only authorized users can access it.
- Insert: Using it, you can import and add images, media, objects, shapes, etc., to a spreadsheet.
Final Thoughts:
LibreOffice Calc is a great frequency polygon maker software through which you can create and adjust various parameters of a frequency polygon graphs without putting much effort. You can also create various other data visualization graphs as mentioned above.
WPS Office
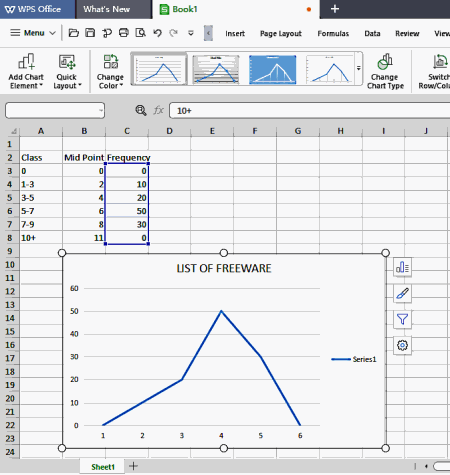
WPS Office is a free cross-platform office software for Windows, Linux, macOS, Android, and iOS. This software can also be used as a frequency polygon maker software. To create frequency polygon graphs, it provides a WPS Spreadsheet module. However, you can find many other office modules in it such as WPS Writer, WPS Presentation, etc. In the Spreadsheet module, you can enter the values of the frequency polygon graph and use its insert graph feature to plot a frequency polygon graph.
How to create a frequency polygon graph using WPS Office:
- Launch this software and create a new spreadsheet.
- After that, name two or more columns according to the number of parameters you want in the frequency polygon graph to represent.
- Now, enter parameter values in the rows of newly created parameter columns.
- After that, select all the parameter values and choose a line chart from the Chart menu.
- Now, you can view a frequency polygon graph representing the parameters.
- Lastly, you can name the graph, adjust background color, change graph line type, etc., by going to its Formatting section to complete the graph.
You can save the frequency polygon graph along with the graph values in XLSX, PDF, HTML, CSV, etc., formats.
Additional Features:
- Encrypt: Using it, you can encrypt a spreadsheet to protect it from unauthorized users.
- Convert+: It is a file conversion feature through which you can convert perform conversions like PDF to Word, PDF to PPT, Picture to PDF, etc.
- Protect Sheets: It is a handy tool that allows you to protect some or all cells of a sheet from editing.
Limitations:
- In the free version of WPS Office, you will get ads in the form of popups even when you are not working on the WPS Office.
Final Thoughts:
It is beautifully designed and easy to use frequency polygon graph maker software through which you can create any type of frequency polygon graph.
Gnumeric
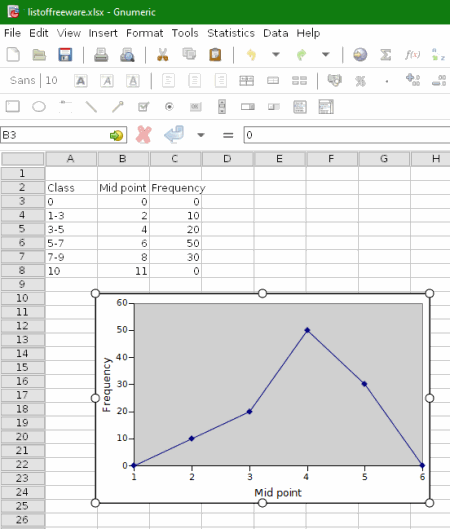
Gnumeric is yet another free frequency polygon maker software for Windows. It is also a dedicated spreadsheet software that allows you to create frequency polygon graphs. Besides frequency polygon, you can also use it to create Area Graphs, Bar graphs, Matrix graphs, Pie Charts, etc. Plus, all other standard spreadsheet features are also present in it. In order to create a frequency polygon graph, I have mentioned the steps below which you can checkout.
How to create frequency polygon using Gnumeric:
- Initiate this software and name columns according to the number of parameters which you have.
- After that, enter the values of columns to provide frequency polygon values.
- Next, select values of one or more columns and go to Insert > Chart menu.
- Now, select a type of the Line graph from the Chart menu and press the Insert button to view the frequency polygon graph.
- To change graph colors, x & y-axis parameters (style, font, text, etc.), line properties (interpolation, color, size, etc.), etc., go to graph properties by double-clicking on the frequency polygon graph.
You can save both the graph and its values in formats like XLS, XML, ODS, SYLK, etc.
Final Thoughts:
It is a straightforward frequency polygon maker software through which you can also create various other types of charts and graphs.
SoftMaker Free Office
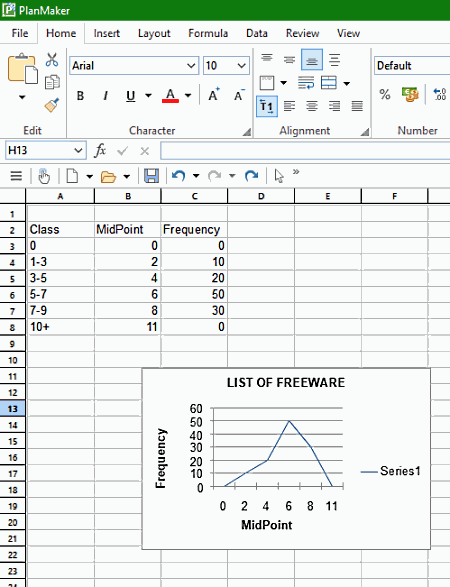
SoftMaker Free Office is the next free office software that can also be used as a frequency polygon maker software for Windows. This office suite comes with three office modules namely TextMaker, PlanMaker, and Presentations. From three available office modules, you need its PlanMaker module to create a frequency polygon. In the Planmaker module, you get a spreadsheet like interface where you can save datasets. In columns, you can create frequency polygon parameters and enter their values in fields (rows). To build the final frequency polygon graph, it offers a Chart Frame section through which you can also create standard pie charts, bar charts, cone charts, box plot charts, etc.
How to create frequency polygon using SoftMaker Free Office:
- Launch this software and open up its PlanMaker module.
- After that, enter headings of the frequency polygon in columns of the spreadsheet.
- Next, enter the values of parameters in the rows.
- After that, select all values of one or more rows and go to Insert > Chart Frame section.
- From the Chart Frame section, select a line graph and press OK to view the frequency polygon graph on its interface.
- Lastly, double click on the graph to adjust format, font, line thickness, colors of graphs, etc., parameters.
The final frequency polygon graph along with its values can be saved in formats like XLS, PPT, TMDX, SLK, CSV, etc.
Additional Feature:
- Sheet Protection: This feature helps you to protect your sheets from unauthorized access.
Final Thoughts:
It is a good frequency polygon maker software that also offers a good set of productivity features.
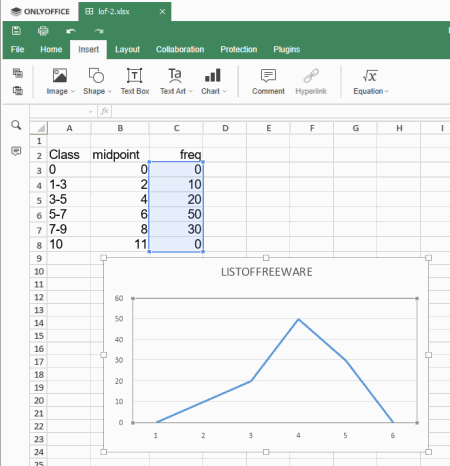
ONLYOFFICE
ONLYOFFICE is another free open software office software that can also be used as a frequency polygon maker software. It works on Windows, macOS, and Linux. As it is an office software, thus it offers multiple office modules namely Document, Spreadsheet, and Presentation. You only need its Spreadsheet module to create a frequency polygon graph.
How to create a frequency polygon graph using ONLYOFFICE:
- Start this software and create a new spreadsheet.
- Now, name at least two columns according to the two polygon graph parameters. I named columns as midpoint and frequency.
- Next, enter the values to the rows of midpoint and frequency columns.
- After that, select all the values of the frequency column and go to Insert menu and choose a Line Chart. Immediately, you can view a frequency polygon graph on the interface.
- Next, go to chart advanced settings to specify minimum and maximum values of vertical and horizontal axis of the graph. Many other options to adjust axis settings, chart title, data series, etc., are also present in it.
- After completing the graph, you can save the entire spreadsheet along with the graph in formats like XLSX, ODS, CSV, PDF, etc.
Additional Features:
- Protection: Using it, you can password protect and encrypt a spreadsheet to protect it from unauthorized users.
- Insert: Use it to add images, tables, shapes, text box, etc., over the spreadsheet.
Final Thoughts:
It is another decent frequency polygon maker software that offers all necessary tools to create single as well as multiple parameters based frequency polygon graphs.
OOo4Kids
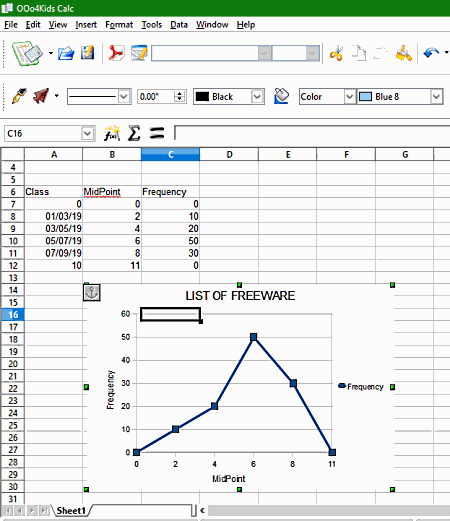
OOo4Kids is a free and lightweight frequency polygon maker software for Windows. Like other similar software, it is also a free office software. However, unlike other office software, it is built especially for kids. In it, you can find all essential office software modules like Spreadsheet, Presentation, Drawing, Formula, etc. You only need its Spreadsheet module as it offers a chart section through which you can create a frequency polygon graph. Besides this, it also offers columns and rows to create and enter frequency polygon parameters and their values.
How to create a frequency polygon graph using OOo4Kids:
- Start this software and open up its Spreadsheet module.
- After that, assign names of frequency polygon parameters to columns and their values in rows.
- Next, select all values of rows and click on the Chart section.
- In the chart section, you can find multiple types of charts like column, bar, line, bubble, etc. You need to select the Line chart.
- After that, specify data range, data series, and chart elements (graph title, x-axis name, y-axis name, etc.) to complete the frequency polygon graph.
You can save the final frequency polygon graph and its values in formats like ODF, XLS, XML, CSV, XLT, etc.
Final Thoughts:
It is an easy to use office software that offers all essential office features along with a good frequency polygon graph maker option.
IBM Lotus Symphony
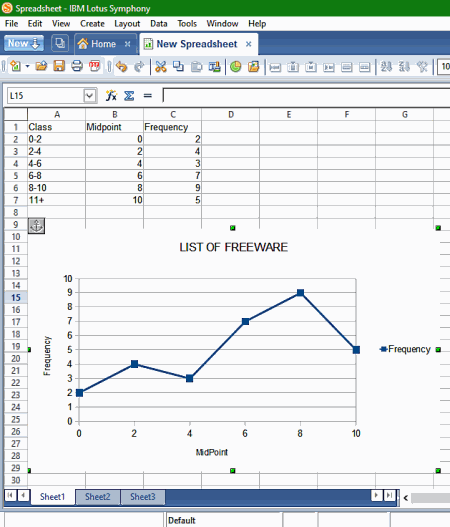
IBM Lotus Symphony is one more free frequency polygon maker software for Windows. In it, you can easily create frequency polygon graphs along with pie charts, area charts, stock charts, bar charts, etc. In addition to that, you can also perform office productivity tasks using its Presentation, Documents, Spreadsheets, etc., modules. Its spreadsheet module is the main module as it offers a Create Chart section that allows you to create different types of charts and graphs including the frequency polygon graphs.
How to create a frequency polygon graph using IBM Lotus Symphony:
- Launch this software and create a new spreadsheet by going to its new menu.
- Next, name one or more columns according to the number of parameters you want in your graph.
- After that, enter values of created parameters in the rows of the spreadsheet.
- Now, select all the values and click on the Create Chart option to open up a Chart Wizard.
- From the Chart Wizard, you need to select the line graph.
- After that, specify other important frequency polygon graph characteristics like data range, data series, chart elements, etc., to complete the graph.
The final graph and all its values can be saved in various formats like ODS, ODT, XLS, STC, etc.
Additional Features:
- Merge Documents: Using it, you can merge cells of two different spreadsheets into one.
- Compare Documents: Through this feature, you can quickly find out the similarities and differences between any two documents.
- Protect Document: It allows you to password protect your documents.
Final Thoughts:
It is another easy to use office software through which you can also easily create frequency polygon graphs.


Naveen Kushwaha
Passionate about tech and science, always look for new tech solutions that can help me and others.
About Us

We are the team behind some of the most popular tech blogs, like: I LoveFree Software and Windows 8 Freeware.
More About UsArchives
- May 2024
- April 2024
- March 2024
- February 2024
- January 2024
- December 2023
- November 2023
- October 2023
- September 2023
- August 2023
- July 2023
- June 2023
- May 2023
- April 2023
- March 2023
- February 2023
- January 2023
- December 2022
- November 2022
- October 2022
- September 2022
- August 2022
- July 2022
- June 2022
- May 2022
- April 2022
- March 2022
- February 2022
- January 2022
- December 2021
- November 2021
- October 2021
- September 2021
- August 2021
- July 2021
- June 2021
- May 2021
- April 2021
- March 2021
- February 2021
- January 2021
- December 2020
- November 2020
- October 2020
- September 2020
- August 2020
- July 2020
- June 2020
- May 2020
- April 2020
- March 2020
- February 2020
- January 2020
- December 2019
- November 2019
- October 2019
- September 2019
- August 2019
- July 2019
- June 2019
- May 2019
- April 2019
- March 2019
- February 2019
- January 2019
- December 2018
- November 2018
- October 2018
- September 2018
- August 2018
- July 2018
- June 2018
- May 2018
- April 2018
- March 2018
- February 2018
- January 2018
- December 2017
- November 2017
- October 2017
- September 2017
- August 2017
- July 2017
- June 2017
- May 2017
- April 2017
- March 2017
- February 2017
- January 2017
- December 2016
- November 2016
- October 2016
- September 2016
- August 2016
- July 2016
- June 2016
- May 2016
- April 2016
- March 2016
- February 2016
- January 2016
- December 2015
- November 2015
- October 2015
- September 2015
- August 2015
- July 2015
- June 2015
- May 2015
- April 2015
- March 2015
- February 2015
- January 2015
- December 2014
- November 2014
- October 2014
- September 2014
- August 2014
- July 2014
- June 2014
- May 2014
- April 2014
- March 2014
