9 Best Free Regression Analysis Software for Windows
Here is a list of Best Free Regression Analysis Software for Windows. These freeware let you evaluate a set of data by using various regression analysis models and techniques. Regression analysis is basically a kind of statistical data analysis in which you estimate relationship between two or more variables in a dataset. It helps you assess a set of data, determine factors that are important and factors that are not so important, and make better decisions.
These freeware come with different regression analysis techniques that you can use for data estimation. Linear Regression, Multiple Regression, Logistic Regression, Non-Linear Regression, Standard Line Assay, Polynomial Regression, Non-parametric Simple Regression, and Correlation Matrix are some of the analysis models which are provided in these software. You get more built-in statistical models in these listed software. For example, T-Tests, ANOVA, Descriptive Statistics, Reliability Analysis, Univariate Analysis, Bivariate Correlation, K-Means Cluster, Frequency Tests, Factor Analysis Tests, Probability Distribution, etc.
As input, these software support a lot of data file formats such as TSV, CSV, XLS, XLSX, TXT, DAT, etc. You can also manually insert data in rows and columns as all these provide a spreadsheet-like interface. The analysis results displayed can be saved in various formats like PDF, HTML, Text, etc. Overall, these are feature rich statistical and regression analysis software which provide comprehensive results.
My Favorite Free Regression Analysis Software for Windows:
JASP is one of my favorite software as you can find all required tools and features in it which enable you to perform regression and statistical analysis. Plus, additional modules to add some other statistical techniques and models can also be found in it. I also like its user interface design as it is clean, intuitive, and user friendly.
Statcato is another good software which you can try.
You may also like to check out lists of best free Statistical Analysis Software , Econometric Software, and Data Visualization Tools for Windows.
JASP
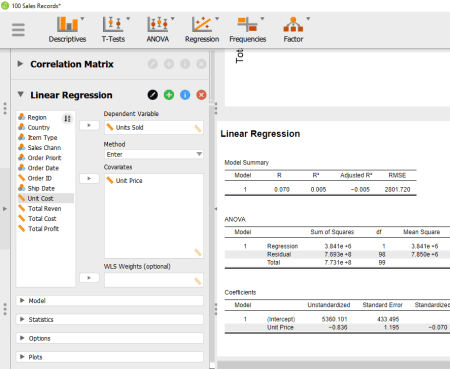
JASP is a great free regression analysis software For Windows and Mac. It is basically a statistical analysis software that contains a Regression module with several regression analysis techniques. Using these regression techniques, you can easily analyze the variables having an impact on a topic or area of interest. Besides that, ANOVA, T-Tests, Descriptive Statistics, Reliability Analysis, Frequency Tests, Principal Component Analysis, Exploratory Factor Analysis, and Confirmatory Factor Analysis are the statistical methods provided for data estimation in this software. As you perform statistical analysis or regression analysis, it displays related results with a summary in a dedicated section on its main interface.
Main Features:
- To import a dataset, it supports several input sources including local files (CSV, TXT, ODS, XPT, SAV, etc.) and data input from Open Science Framework (OSF) account. It has a data library with some sample data files.
- In it, different types of regression techniques are present which you can use and apply on an input dataset. These regression techniques include Linear Regression, Bayesian Linear Regression, Logistic Regression, Correlation Matrix, Bayesian Correlation Matrix, and Bayesian Correlation Pairs.
- While applying a regression technique, you can choose to include or exclude specific statistics in results. For example, R squared change, Model fit, Covariance matrix, Residuals, Collinearility diagnostics, Part and partial correlations, etc. Also, you can set up some parameters of an applied regression algorithm such as model, stepping method criteria, etc.
- It lets you plot various graphs for computed regression statistics.
- You can export regression analysis results in an HTML file.
Additional Features:
You can add some more statistical analysis features to this software using its “+” button. These features include Audit, BAIN, Network, Machine Learning (Regression, Classification, Clustering), Meta Analysis, Structural Equation Modeling (SEM), and Summary Statistics.
Conclusion:
It is one of my favorite regression analysis software as it provides different regression techniques and a lot of other statistical data analytic methods. It is also very user-friendly which anyone can use without much hassle.
PSPP
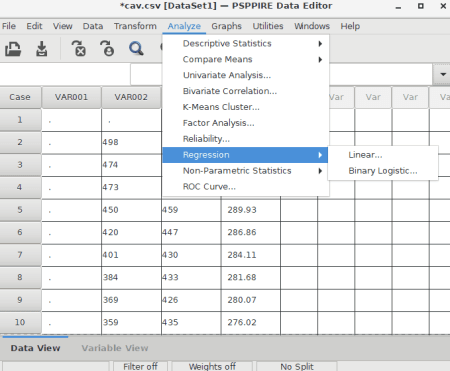
PSPP is a free regression analysis software for Windows, Mac, Ubuntu, FreeBSD, and other operating systems. It is a statistical analysis software that provides regression techniques to evaluate a set of data. You can easily enter a dataset in it and then perform regression analysis. The results of the regression analysis are shown in a separate Output Viewer window with all steps.
Besides regression analysis algorithms, it has several other statistical methods which help you perform data analysis and examination. Some of these methods include Descriptive Statistics, Compare Means, Univariate Analysis, Bivariate Correlation, K-Means Cluster, Factor Analysis, Reliability Analysis, ROC Curve, and Non-Parametric Statistics. It also lets you transform data using Compute, Count, Rank Cases, Automatic Recode, and other methods. Plus, scatterplot, bar chart, and histogram charts can be plotted for selected variables or dataset.
Key-features of this regression analysis software:
- You can manually enter the dataset that you want to evaluate or import data from local files like CSV, TSV, Text files, OpenDocument Spreadsheet files, Gnumeric Spreadsheet files, etc.
- It provides Linear and Binary Logistic Regression techniques for the analysis of data.
- You can select the statistics to compute to perform regression analysis, such as correlation between observed and predicted values, analysis of variance table, variance coefficient matrix, regression coefficient, etc.
- The output of regression analysis or any computed statistics can be directly printed or exported to a local file like PDF, HTML, Text, PS, CSV, etc.
Additional Features:
- It provides a Variable View tab that displays all variables with type, width, decimal, missing values, measure, role, and other information.
- You get a dedicated set of options to sort data accordingly.
- You can also use it from the terminal mode using syntax.
Conclusion:
It is a nice and simple regression analysis software using which you can perform data analysis with different kinds of statistical methods.
Statcato
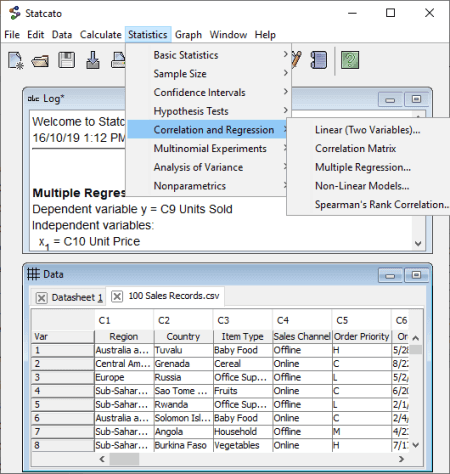
Statcato is a free, portable, Java-based regression analysis software for Windows, Linux, and Mac. To run this software, you need to have Java installed on your system. You can download Jave from here.
Like many other listed software, it is also a statistical analysis software that contains a lot of data analytic methods for data estimation and evaluation. These methods include Regression techniques as well as algorithms like Hypothesis Tests (1-Population Mean, 1-Population Variance, 1-Population Proportion, Matched Pairs, etc.), Analysis of Variance (ANOVA), Sample Size, Descriptive Statistics, Normality Tests, Non-parametric Tests, and more. Plus, you can also compute probability distributions, p-Value, and frequency table using it. Furthermore, it offers several data visualization graphs to analyze data using charts which include bar chart, box plot, dot plot, histogram, normal quantile graph, pie chart, scatterplot, stem and leaf plot, and residual plot.
Key Features:
- It lets you manually input the dataset in its Data window. If you have a dataset in an existing local file, you can import it and the supported formats for this are XLS, CSV, and TXT. You can also import a data file from its built-in datasets or from online datasets.
- It offers different regression analysis models which are Linear Regression, Multiple Regression, Correlation Matrix, Non-Linear Regression, etc.
- The results with regression analysis statistics and summary are displayed in the Log window.
- You can directly print the output of regression analysis or use the Print option to save results in PDF format.
Additional Features:
- It provides different options to manipulate and generate data including sort, rank, transpose, standardize, generate patterned data, generate random data, etc.
- An auto-backup option is also provided in this software.
Conclusion:
Statcato is a free open source regression analysis software that lets you perform statistical analysis on a numerical dataset and you can also visualize data on various graphs.
Jamovi
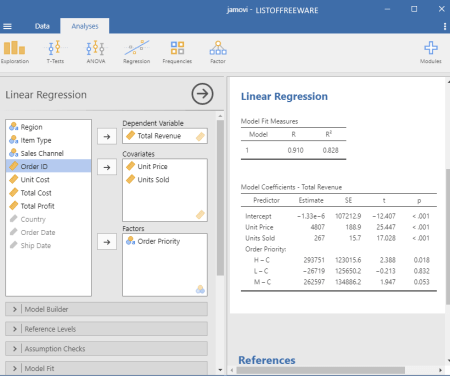
Jamovi is yet another free regression analysis software Windows, Linux, Mac, and Chrome OS. It is a nice, clean, and user friendly statistical analysis software that is dedicated to performing data analysis tasks. On its main interface, you can find a Regression module with related techniques. Other statistical models including Exploration, T-Tests, ANOVA, Frequency Tests, and Factor Analysis Tests can also be used to analyze datasets.
Key Features:
- The regression analysis models that can be used are Linear Regression, Correlation Matrix, and Logistic Regression (binomial, multinomial, ordinal outcomes) techniques.
- It provides a separate Data tab to manually input your data. You can even insert datasets from data files like CSV, R data files, JASP files, Stata files, etc.
- Before performing regression analysis, you can setup initial options including model builder, reference levels, assumption checks, fit measures, model coefficients, and estimated marginal means.
- You can save regression analysis results in PDF or HTML format.
Additional Feature:
Some additional modules can be installed and added to this software from Jamovi Library. These modules basically enhance its feature set, such as Bayesian Methods, R data sets, Graphically Based Data Analysis, Meta Analysis, Survival Analysis, etc.
Conclusion:
It is a nicely designed regression analysis software with comprehensive results. You can also improve its functionality by manually adding some more statistical models to it.
PAST
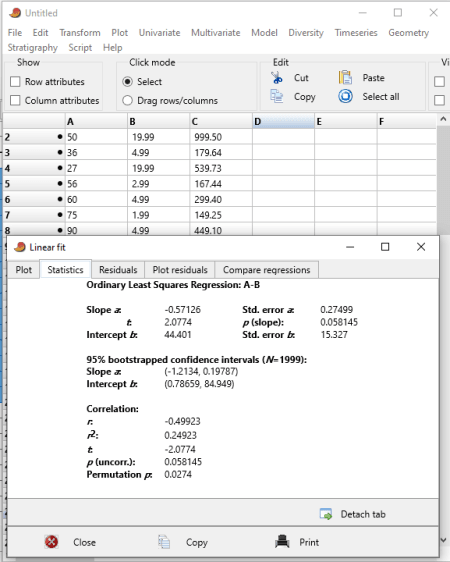
PAST is a featured statistical analysis software for Windows and Mac. It provides a variety of techniques and models which help you in data estimation, evaluation, and analysis. You can use regression analysis models and other statistical techniques for statistical data analysis. In it, you get ANOVA, Correlation, Normality test, Ordination, Clustering, Diversity Tests, Timeseries Analysis Tests, etc. Also, various types of plots are provided in it for data visualization, such as histogram, pie chart, bar chart, mosaic chart, radar chart, network chart, 3D plot, etc.
Main Features:
- The supported input formats to import numerical datasets are Text and Excel formats.
- You can find a lot of regression analysis models in it such as linear regression, multiple regression, multivariate regression, polynomial regression, sinusoidal regression, etc.
- It displays plot, statistics, residuals, residuals plot, and regression comparison in its results window.
- You can select a plot type from scatterplot and histogram to visualize results.
- To plot a regression analysis graph, you can select a desired method such as Ordinary LS, RMA, Robust, Prais-Winsten, etc.
- It allows you to directly print the output of a regression analysis.
Additional Features:
- It offers a lot of geometrical analysis techniques such as directional analysis, point pattern analysis, point with z values, landmarks (2D/3D), Elliptic Fourier, Hangle Fourier, etc.
- A set of stratigraphy methods are also available in it such as Unitary Associations, Ranking-Scaling (RASC), Range Confidence Level, etc.
Conclusion:
Overall, it is one of the best free statistical analysis software which contains several regression analysis models for data assessment.
KyPlot

KyPlot is a data analysis and visualization software which can also be used to perform regression analysis. A dedicated set of regression analysis models is provided in it that helps you estimate data. Also, a variety of statistical models are available in this software that are helpful in data analysis and decision making. For example, Descriptive Statistics, Contingency Tables, Parametric Tests, Non-Parametric Tests, Multivariate Analysis, Survival Analysis, etc.
Furthermore, you can find tons of mathematical computation methods in it such as matrix operations, equations, integrations, 1D Fourier Transformation, time series analysis, spectral analysis, wavelet analysis, deconvolution, non-linear optimization, etc. Plus, Data Visualization (2D graphs, step graphs, radar graph, pie chart, mesh graph, waterfall graph, table graph, 3D graph, etc.) and Data Manipulation (sort, extract, transform, differentiate, integrate, etc.) features can also be found in it. All in all, it is quite a handy software for statisticians.
Main Features:
- As input, it supports datasets in XLS and TXT formats.
- The regression analysis models available in it include Simple Regression, Standard Line Assay, Polynomial Regression, Multiple Regression, and Non-parametric Simple Regression. You can also perform a parallelism test between two regression lines and a Hollander’s test for parallelism of two regression lines.
- You can save a datasheet after editing data or performing regression analysis. For this, the supported formats are XLS, XLSX, TXT, CSV, etc. It also lets you export the view in WMF, PNG, PSD, EPS, and other image formats.
Conclusion:
It is another good free regression analysis software which is helpful for statisticians.
Matrixer
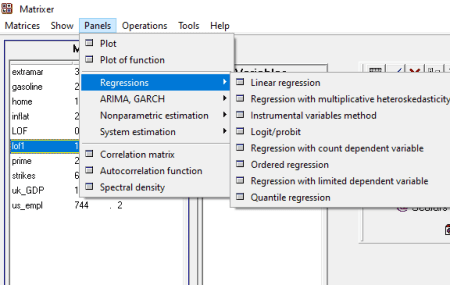
Matrixer is the next free regression analysis software for Windows. It is primarily an econometric software that helps you analyze economical data using various econometric models. It contains a set of several regression analysis techniques for data evaluation. You can also plot a graph for the imported datasets.
Main Features:
- It supports TXT, CSV, DAT, ASC, and other formats to input data to this software. You can also find some sample datasets which you can use to get started with it.
- It can be used to apply Linear Regression, Logit/Probit, Instrumental Variable Methods, Ordered Regression, Quantile Regression, Regression with count dependent variable, and Regression with limited dependent variables techniques on imported datasets.
- You can also perform analysis including Regression with GARCH error, Regression with ARMA error, Box-Jenkins model (ARIMA), ARFIMA-FIGARCH, Nonparamtetric regression and Nonparamteric density estimation, Simultaneous equations, Vector autoregression, etc.
- Some mathematical operations like create vector, transpose, invert, sum, matrix product, subtract, direct division, etc., can also be performed.
Conclusion:
Matrixer is a good regression analysis software with a lot of regression models for data analysis.
SHAZAM
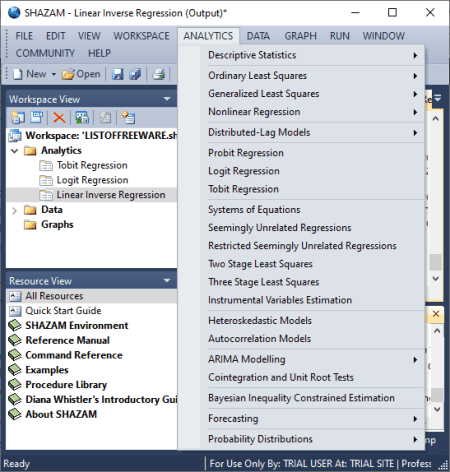
SHAZAM is one more regression analysis software for Windows. It is a powerful data analysis software that can be used in a number of fields like economics, biometrics, sociometric, applied statistics, etc. Several complex statistical analysis methods can be used without much hassle in it. Some of the data analytic models available in it include several regression analysis techniques, descriptive statistics, ordinary least squares, generalized least squares, ARIMA model, system of equations, two stage least squares, three stage least squares, instrumental variable estimation, Heteroskedastic models, autocorrelation models, cointegration and unit root tests, probability distribution, and more.
You can create a new workspace in it and then add datasets to the created workspace. Afterward, you can use provided statistical models on added datasets for data evaluation and assessment. The datasets, graphs, and analytics performed can be viewed from the Workspace panel.
Main Features:
- It contains Nonlinear Regression, Probit Regression, Logit Regression, Tobit Regression, and more regression models.
- You can import data in CSV, Text, and a few other formats.
- It lets you copy results and save graphs in image formats.
Limitations:
This is a trial version of SHAZAM which can be used for free for an unlimited time. Although, it has a limitation that only a limited amount of memory can be used for calculations.
Conclusion:
It is a good regression analysis software that is suitable for extensive statistical data analysis.
Draco Econometrics
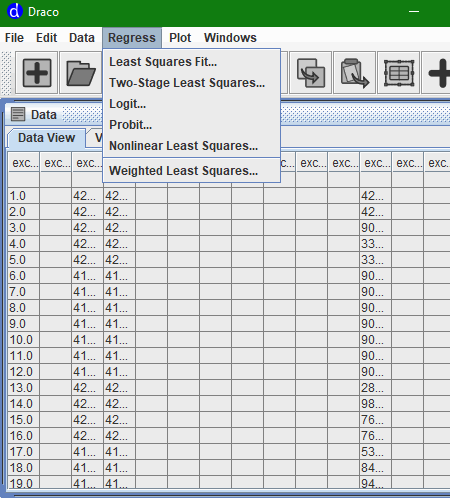
Draco Econometrics, as the name suggests, is an economical data analysis software for Windows and Linux. You get different regression analysis techniques in its Regress menu which can be used easily. Let’s see what are the models provided in it.
Main Features:
- It contains models including Least Squares Fit, Two-Stage Least Squares, Logit Regression, Probit Regression, Nonlinear Least Squares, and Weighted Least Squares.
- You can also find One-Factor ANOVA and Extended Statistics to estimate data.
- Apart from data analysis model, it provides data plotting features too. For that, you get column and histogram charts.
- It supports Text, ODS, XLS, XLSX, and other formats as input datasets. You can also manually add data to it.
Conclusion:
It is a simple regression analysis software with a basic feature set when compared to other listed software.


About Us

We are the team behind some of the most popular tech blogs, like: I LoveFree Software and Windows 8 Freeware.
More About UsArchives
- May 2024
- April 2024
- March 2024
- February 2024
- January 2024
- December 2023
- November 2023
- October 2023
- September 2023
- August 2023
- July 2023
- June 2023
- May 2023
- April 2023
- March 2023
- February 2023
- January 2023
- December 2022
- November 2022
- October 2022
- September 2022
- August 2022
- July 2022
- June 2022
- May 2022
- April 2022
- March 2022
- February 2022
- January 2022
- December 2021
- November 2021
- October 2021
- September 2021
- August 2021
- July 2021
- June 2021
- May 2021
- April 2021
- March 2021
- February 2021
- January 2021
- December 2020
- November 2020
- October 2020
- September 2020
- August 2020
- July 2020
- June 2020
- May 2020
- April 2020
- March 2020
- February 2020
- January 2020
- December 2019
- November 2019
- October 2019
- September 2019
- August 2019
- July 2019
- June 2019
- May 2019
- April 2019
- March 2019
- February 2019
- January 2019
- December 2018
- November 2018
- October 2018
- September 2018
- August 2018
- July 2018
- June 2018
- May 2018
- April 2018
- March 2018
- February 2018
- January 2018
- December 2017
- November 2017
- October 2017
- September 2017
- August 2017
- July 2017
- June 2017
- May 2017
- April 2017
- March 2017
- February 2017
- January 2017
- December 2016
- November 2016
- October 2016
- September 2016
- August 2016
- July 2016
- June 2016
- May 2016
- April 2016
- March 2016
- February 2016
- January 2016
- December 2015
- November 2015
- October 2015
- September 2015
- August 2015
- July 2015
- June 2015
- May 2015
- April 2015
- March 2015
- February 2015
- January 2015
- December 2014
- November 2014
- October 2014
- September 2014
- August 2014
- July 2014
- June 2014
- May 2014
- April 2014
- March 2014
