5 Best Free 3D Data Visualizer Software For Windows
Here is a list of best free 3D data visualizer software for Windows. Using these free data visualization software, you can visualize data in the form of various 3-dimensional graphs. These software provide a lot of 3D plots which include bar graphs, surface plot, parametric surface, area, step, combination, pie, horizontal bar, cluster bar, Gantt chart, etc. You can create realistic or normal 3D plots and also select subtypes of 3D graphs like stacked, percent stacked, etc. Apart from that, you can customize data range, data series, data labels, title, legends, chart area, chart wall, etc. Other than that, these also let you customize 3D view, change shape of graph, etc. The final 3D graph can be copied to the clipboard or exported as PNG, BMP, JPG image, etc.
Most of these are office software which provide spreadsheet application in order to visualize data. You can create a new datasheet or import already existing sheets in formats of ODS, XLS, XLT, CSV, etc. There exist many other data visualization tools (check the list here), but those looking for 3D data visualizer software, this list is handy.
My Favorite Free 3D Data Visualizer Software For Windows:
Past is a nice 3D data visualizer and for that, it provides Scatter, Bubble, Line, Surface Plot, and Parametric Surface 3D plots.
You can also checkout lists of best free Statistical Analysis Software, 3D Graphing Software, and Data Mining Software for Windows.
Past
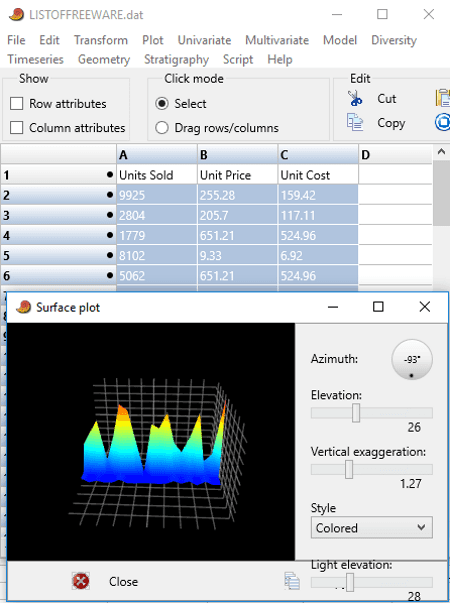
Past is a free and portable statistical analysis software for Windows. Apart from various statistical analysis techniques, it also provides data visualization options. You can visualize a dataset in XLS or TXT format using its Plot menu. Here, you can find numerous 2D graph options like XY graph, histogram, bar chart/boxplot, bubble plot, etc. You can also find a 3D plot option for 3D data visualization. It provides Scatter, Bubble, Line, Surface Plot, and Parametric Surface types of 3D plots. In the 3D graph window, you can rotate view, change elevation, adjust vertical exaggeration, modify style (colored, lighted, or both), and adjust light elevation. It lets you copy 3D graph, print it, or save it as a JPG image.
This software has a spreadsheet-like interface where you can add or import datasets. And then, you can perform various statistical analyses including data manipulation analysis, ecological analysis, time series analysis, spatial analysis, etc. Overall, this is a really good 3D data visualizer software for Windows.
LibreOffice
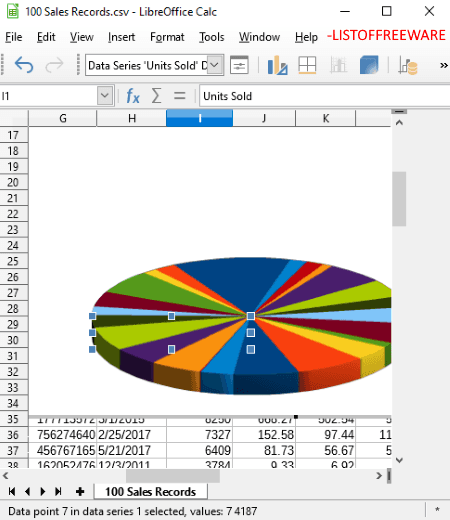
LibreOffice is an open source office suite for Windows, Mac, and Linux. It can be used for data visualization too as it provides a lot of charts. It also provides 3D plots. Hence, you can also use it as a 3D data visualizer. You can open a data sheet and then visualize the data using various charts from the Insert menu. In 3D, you get Bar, Column, Pie, and Area graphs. You can create a realistic or simple 3D data visualization chart. Also, it provides some subtypes of each of the graphs such as normal, stacked, percent stacked, etc. You can also customize shape of graph such as cylinder, cone, pyramid, etc. Furthermore, you can edit Chart Wall properties (border, color, width, transparency, etc.), data series, titles, grid, and legend settings, edit 3D view, etc. Apart from these aforementioned 3D plots, you get a lot of 2D graphs which are pie chart, area graph, bubble, line, net, stock, etc.
You can import files in the format of XML, XLS, XLT, ETT, DIF, WKS, ODS, etc. It lets you copy graph and export it as an image like PNG, BMP, JPG, GIF, WMF, TIF, SVG, etc. You can also save spreadsheet with 3D graphs as ODS, XLSX, XML, CSV format files, etc.
SSuite Office
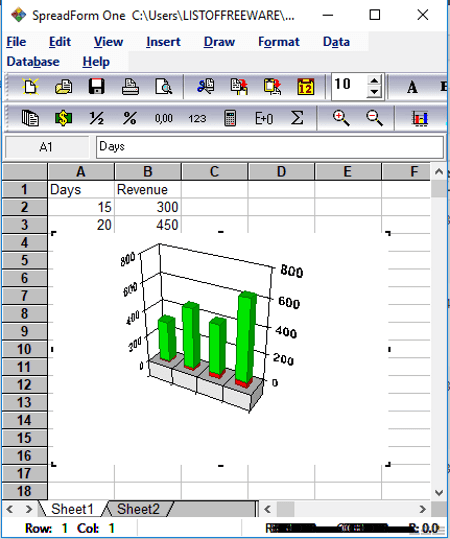
SSuite Office (Personal Edition) is basically a free office software for Windows. Its spreadsheet application can be used as a 3D data visualizer. You can import datasheets in various formats and then visualize their data in the form of 2D and 3D graphs. For 3D data visualization, it provides different kinds of graphs including Area, Bar, Line, Step, Combination, Pie, Horizontal Bar, Cluster Bar, and Gantt Chart.
How to visualize data in 3D using SSuite Office:
- First, import XLS, Tabbed Text, or Formula One file and select the data you want to visualize.
- Go to Insert menu > Chart option and from Chart Wizard, select chart type as 3D and choose the desired graph type.
- You can also select desired style for plotting 3D data, enter desired layout settings (chart title, chart footnote, chart legend, etc.), and axis title.
- As you press Finish in Chart Wizard, it will display the respective 3D graph. You can print the 3D graph.
IBM Lotus Symphony
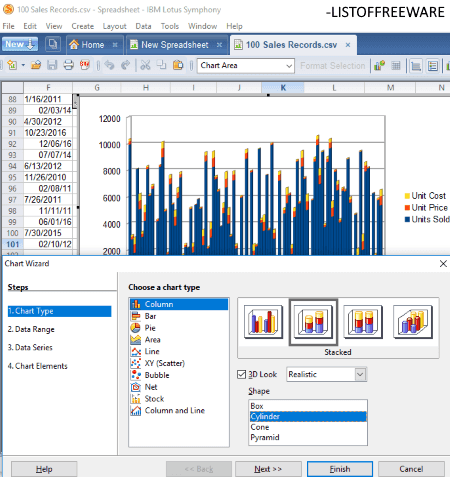
IBM Lotus Symphony is another free office suite for Windows. It also provides a spreadsheet application which lets you visualize data in 3D. You can open a spreadsheet in ODS, XLS, XLT, CSV format, etc., and visualize data in 3D form using its Create menu. From this menu, you can form a 3D chart of imported dataset. It provides Bar, Area, Column, and Pie 3D charts. It also provides some subtypes of each of these graphs such as normal, stacked, percent stacked, donut, etc. You change the style (simple or realistic) and shape (box, cylinder, cone, and pyramid) of the graph. Other than that, it lets you format data series, customize 3D view, create data labels, etc. You can also edit chart area (border, color, transparency, etc.), text, axis properties, chart wall, etc. After that, you can copy 3D graph to the clipboard.
It is another good option to visualize data in 2D as well as 3D form. As it is an office software, you get word processor and presentation maker too.
SciDAVis
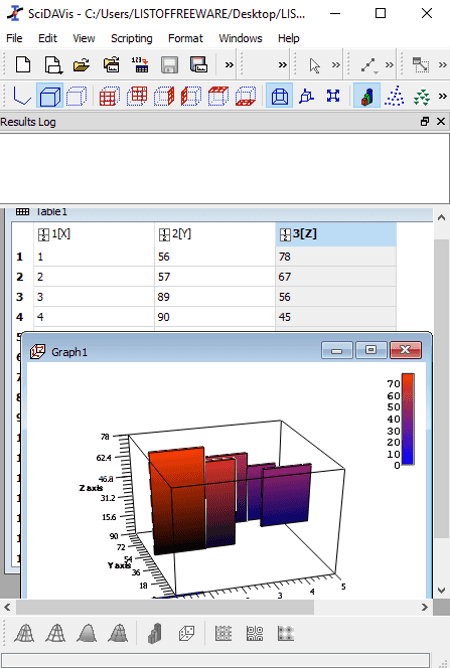
SciDAVis is a free open source 3D data visualizer software for Windows. You can add datasets in its Table window and then visualize data using Plot menu. In this menu, you can find various 3D plots including ribbon, bars, scatter, and trajectory. You can rotate 3D plot using the mouse. It lets you copy the graph, print it, or export it as BMP, PNG, JPG, GIF, PDF, etc., files.
It is a nice free 3D graphing software. It also provides Statistics on Rows/Columns, FFT, Correlate, Autocorrelation, Convolute, Deconvolute, and other analysis tools.
About Us
We are the team behind some of the most popular tech blogs, like: I LoveFree Software and Windows 8 Freeware.
More About UsArchives
- May 2024
- April 2024
- March 2024
- February 2024
- January 2024
- December 2023
- November 2023
- October 2023
- September 2023
- August 2023
- July 2023
- June 2023
- May 2023
- April 2023
- March 2023
- February 2023
- January 2023
- December 2022
- November 2022
- October 2022
- September 2022
- August 2022
- July 2022
- June 2022
- May 2022
- April 2022
- March 2022
- February 2022
- January 2022
- December 2021
- November 2021
- October 2021
- September 2021
- August 2021
- July 2021
- June 2021
- May 2021
- April 2021
- March 2021
- February 2021
- January 2021
- December 2020
- November 2020
- October 2020
- September 2020
- August 2020
- July 2020
- June 2020
- May 2020
- April 2020
- March 2020
- February 2020
- January 2020
- December 2019
- November 2019
- October 2019
- September 2019
- August 2019
- July 2019
- June 2019
- May 2019
- April 2019
- March 2019
- February 2019
- January 2019
- December 2018
- November 2018
- October 2018
- September 2018
- August 2018
- July 2018
- June 2018
- May 2018
- April 2018
- March 2018
- February 2018
- January 2018
- December 2017
- November 2017
- October 2017
- September 2017
- August 2017
- July 2017
- June 2017
- May 2017
- April 2017
- March 2017
- February 2017
- January 2017
- December 2016
- November 2016
- October 2016
- September 2016
- August 2016
- July 2016
- June 2016
- May 2016
- April 2016
- March 2016
- February 2016
- January 2016
- December 2015
- November 2015
- October 2015
- September 2015
- August 2015
- July 2015
- June 2015
- May 2015
- April 2015
- March 2015
- February 2015
- January 2015
- December 2014
- November 2014
- October 2014
- September 2014
- August 2014
- July 2014
- June 2014
- May 2014
- April 2014
- March 2014
