6 Best Free Box Plot Maker Software For Windows
Here is a list of best free box plot maker software for Windows. Using these freeware, you can create box plots for a set of statistical data. For this, you can manually enter data or import data sets from files like CSV, XLS, TXT, DAT, etc. After creating box plot graphs, you can also save the graphs as images or directly print them in most of these software.
Other than basic box plots, some of these box plot makers also let you make different types of box plots such as Factorized Box Plot, Box and Jitter, Violin and Box, Mean and Whisker, etc. Apart from that, you can also customize a lot of box plot related options like quartile method, outliers and notches, etc. One of these also displays various descriptive statistics like mean, median, standard deviation, variance, skewness, kurtosis, range, percentile values, etc. Other than that, you can customize chart appearance like color, viewport, size, axes titles, symbol size, font rotation, etc.
These software provide a lot of statistical analysis tools including data modeling, data visualization, T-Tests, ANOVA, regression, frequencies, principal component analysis, exploratory factor analysis, etc. As for graphs, apart from box plots, you can also create Pie, Bubble, Histogram, 3D plots, Stacked Charts, Matrix Plot, etc., using these.
My Favorite Box Plot Maker Software for Windows:
I liked both gretl and PAST as these let you create different kinds of box plots and you can export the graph to many file formats in these software.
You may also check the list of free Data Visualization Tools, Statistical Analysis Software, and Scatter Plot Makers for Windows.
gretl
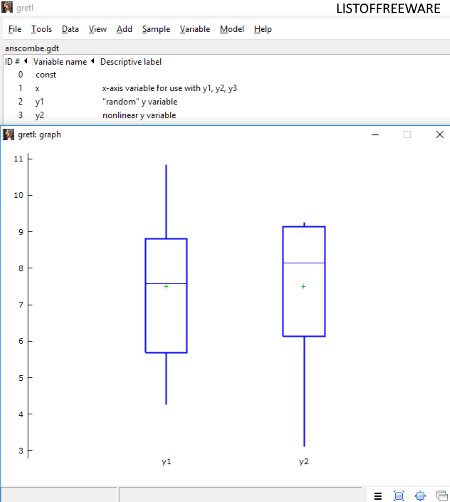
gretl is free open source box plot maker software for Windows. It is basically an econometrics software which is used for analyzing economic data. It lets you plot data in the form of various graphical representations including Box Plot, such as time series graph, XY scatter plot, Q-Q plot, etc. You can import a data set and then create a box plot for it. To import a data set, it supports formats like CSV, ASCII file, XLS, XLSX, ODS, etc. It also comes with some sample economic data files which you can use, such as test data for Poisson regression, pension plan participation, interest rates and inflation, unionization of workers in the US, etc.
How to create box plot using gretl:
- Firstly, open a data set from any of the supported files.
- Next, from Variable menu, you can select Boxplot option to create a box plot. It provides options using which you can create a simple box plot (single variable), box plot with confidence interval for median (single variable), or factorized box plot (two variables).
- In the Box Plot window, you can edit various graph options including title of plot, title for axes, labels, color schemes, arrow, etc. You can also view numerical summary of box plot data. It lets you copy box plot to the clipboard, save it as PNG, WMF, PDF, or EPS file, and directly print it.
gretl is a nice box plot maker and economic data analysis software. To read about its econometrics’ features, check this article.
PAST
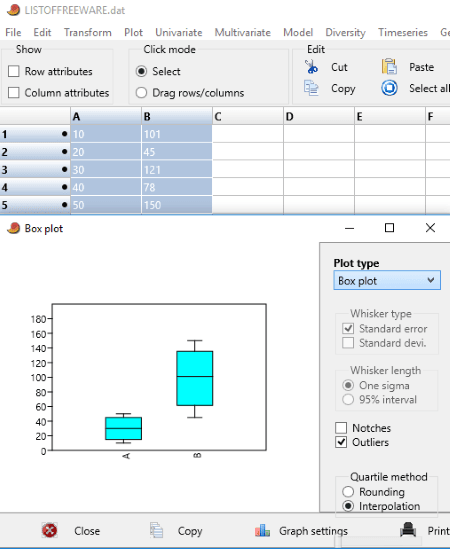
PAST is another free box plot maker software for Windows. Basically, it is a statistical analysis software which lets you analyze statistical data using various techniques like data manipulation analysis, data plotting, univariate and multivariate statistics, ecological analysis, time series analysis, spatial analysis, etc.
To create a box plot using it, import a data file (XLS, TXT, DAT), and select data to plot. Now, go to Plot menu and click on Barchart/Boxplot option. You can now select simple box plot as plot type or choose other types of box plots like Box and Jitter, Violin and Box, Mean and Whisker, etc. It lets you customize a few other options including flip axes, select quartile method (rounding or interpolation), and enable or disable outliers and notches. You can also configure graph settings which include color, viewport, size, color map, symbol size, font rotation, etc. It lets you copy the box plot or directly print it. From its Graph Settings option, you can also save box plot as SVG, PDF, JPG, TIF, GIF, PNG, and BMP files.
Apart from box plot, you can create about 16 types of graphs. Some of these graphs are Pie, Bubble, Histogram, 3D plots, Stacked Charts, Matrix Plot, etc.
Orange
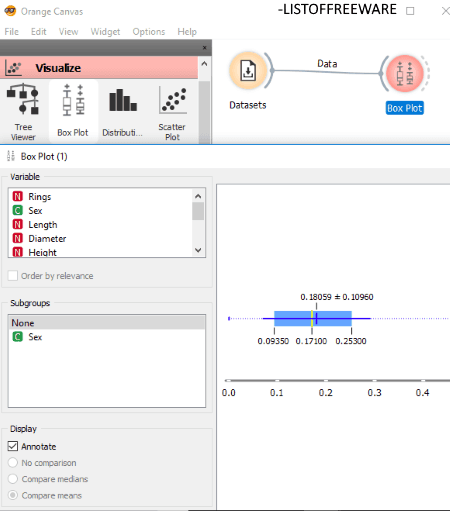
Orange is a free data mining software for Windows which lets you extract useful information from raw data. It provides data modeling, data evaluation, text mining, and data visualization techniques to do so. Among various data visualization techniques, you can find Box Plot too which lets you create box plot for a set of data. Other data visualization tools include Silhouette Plot, Pythagorean Tree Visualization, Nomogram, FreeViz projection, Linear projection, Radviz, Heat Map, Venn Diagram, Distribution, Scatter Plot, Sieve Diagram, etc.
How to create a box plot using this free software: Orange?
The method to create a box plot in this software is quite different than other listed software. In it, different tools are used as individual widgets. To create widgets, you need to drag and drop the respective option to its canvas. After that, you can connect widgets to perform various data mining operations.
To create a box plot, you can first create a widget from the File or Datasets tool present in Data toolbox. After then, import a data set from files like TSV, CSV, XLS, XLSX, etc., or from a URL. After that, drag and drop Box Plot tool from Visualize toolbox and connect the two widgets. On clicking Box Plot, you can view box plot graph for any of the variables. You can save the box plot as a PNG, PDF, or SVG file, or you can save the report with comments as an HTML file.
JASP
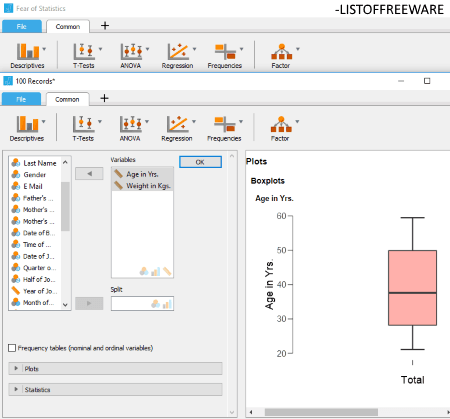
JASP is a free statistical analysis software for Windows. Using it, you can create a box plot for a set of data. From its File tab, you can import a data set in CSV, TXT, SAV, and ODS format. Then, you can go to its Descriptive > Descriptive Statistics option. From Plots drop-down menu, you can select Boxplots option and choose the variables to plot. As you choose variables, it will display individual box plots for each of them in an adjacent section. It also displays statistics like mean, median, standard deviation, variance, skewness, kurtosis, range, percentile values, etc. You can also enable or disable which statistics you want or don’t want to view. It lets you export results with box plots as an HTML file.
Other than box plots, you can create correlation plots and distribution plots too. As it is a statistical analysis software, you can find various statistic related techniques including T-Tests, ANOVA, Regression, Frequencies, Principal Component Analysis, Exploratory Factor Analysis, etc. You can also find tools like Meta-analysis, Network, SEM, etc., in it.
SoftMaker FreeOffice
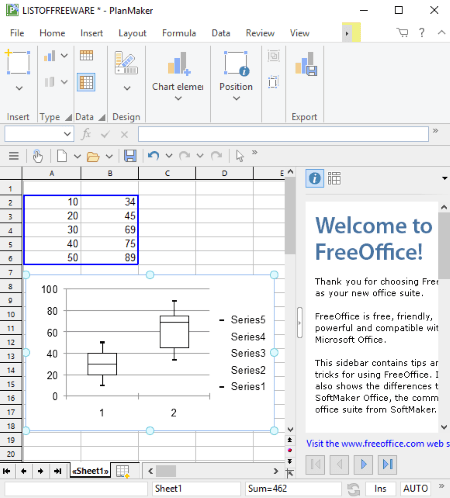
SoftMaker FreeOffice, as the name suggests, is a free office software for Windows. You can use its spreadsheet application which is PlanMaker as a box plot maker. In this application, you can import a data set from XLS, XLSX, TXT, CSV files, etc. Now, select the data from spreadsheet and go to Insert menu > Chart Frame > Box plot chart (horizontal or vertical) option. You will be able to view a box plot for selected set of data. Apart from that, it lets you create various other graphs such as columns, bars, line, area, XY scatter, bubble, radar, surface, pie, stock chart, etc.
It lets you customize chart appearance. You can add trendline, edit chart area (border, filling, font, etc.), and customize chart properties (color, data source, series, etc.). After making changes, you can export box plot or any other graph to an image file (PNG, GIF, BMP, TIF, JPG) or simply copy it to the clipboard.
Free Graph Maker
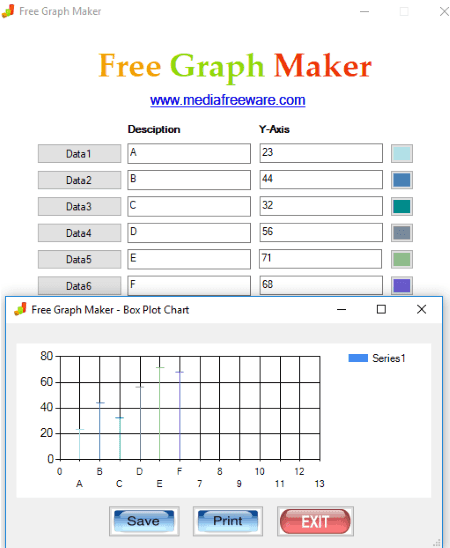
Free Graph Maker, as the name implies, is a free graph making software for Windows. In it, you need to manually add data in the given space. After that, click on the Box Plot button and you will get the respective graph. You can print the box plot or save it as JPEG, GIF, and BMP images.
Apart from box plot, you can create line, bar, pie, radar, column, pyramid, and area charts using it.


About Us

We are the team behind some of the most popular tech blogs, like: I LoveFree Software and Windows 8 Freeware.
More About UsArchives
- May 2024
- April 2024
- March 2024
- February 2024
- January 2024
- December 2023
- November 2023
- October 2023
- September 2023
- August 2023
- July 2023
- June 2023
- May 2023
- April 2023
- March 2023
- February 2023
- January 2023
- December 2022
- November 2022
- October 2022
- September 2022
- August 2022
- July 2022
- June 2022
- May 2022
- April 2022
- March 2022
- February 2022
- January 2022
- December 2021
- November 2021
- October 2021
- September 2021
- August 2021
- July 2021
- June 2021
- May 2021
- April 2021
- March 2021
- February 2021
- January 2021
- December 2020
- November 2020
- October 2020
- September 2020
- August 2020
- July 2020
- June 2020
- May 2020
- April 2020
- March 2020
- February 2020
- January 2020
- December 2019
- November 2019
- October 2019
- September 2019
- August 2019
- July 2019
- June 2019
- May 2019
- April 2019
- March 2019
- February 2019
- January 2019
- December 2018
- November 2018
- October 2018
- September 2018
- August 2018
- July 2018
- June 2018
- May 2018
- April 2018
- March 2018
- February 2018
- January 2018
- December 2017
- November 2017
- October 2017
- September 2017
- August 2017
- July 2017
- June 2017
- May 2017
- April 2017
- March 2017
- February 2017
- January 2017
- December 2016
- November 2016
- October 2016
- September 2016
- August 2016
- July 2016
- June 2016
- May 2016
- April 2016
- March 2016
- February 2016
- January 2016
- December 2015
- November 2015
- October 2015
- September 2015
- August 2015
- July 2015
- June 2015
- May 2015
- April 2015
- March 2015
- February 2015
- January 2015
- December 2014
- November 2014
- October 2014
- September 2014
- August 2014
- July 2014
- June 2014
- May 2014
- April 2014
- March 2014
